Entering energy production data
Introduction
The document contains a quick user guide for the AMAGE Web application for viewing and entering production data for power generation plants. This is a quick guide.
| A description of all the functions of the application can be found in the main manual (in particular, system configuration). |
Login and basic views
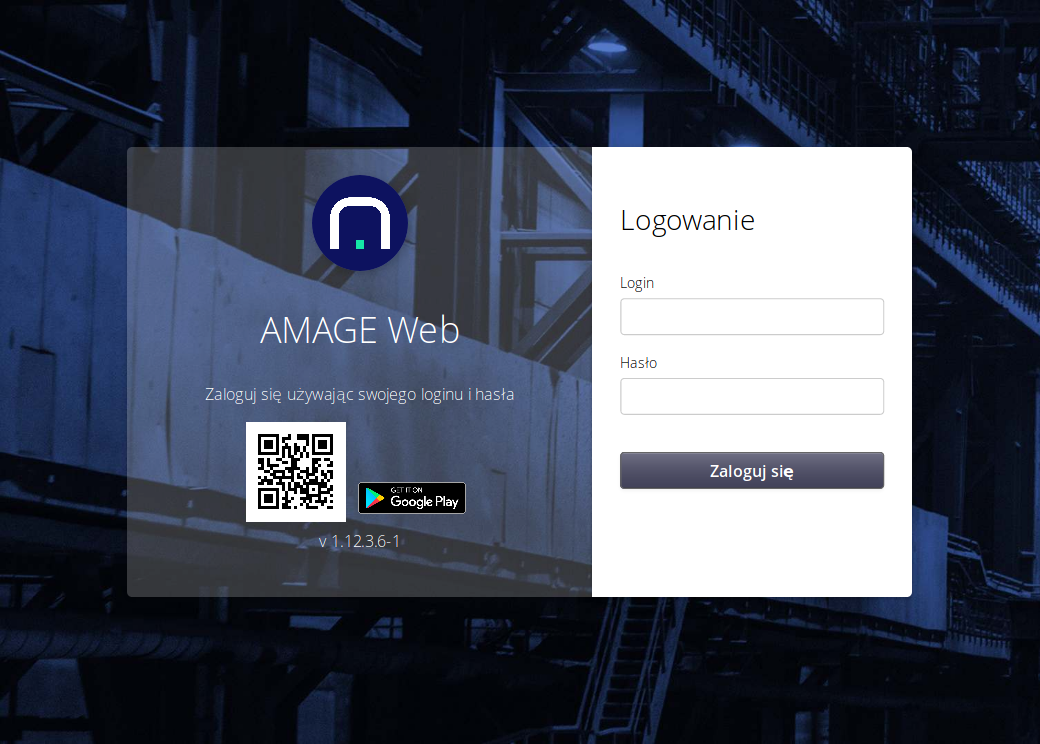
After selecting the address on which the system is running in the address bar of the web browser, the application login window appears. We use the provided login data, i.e. login and password.
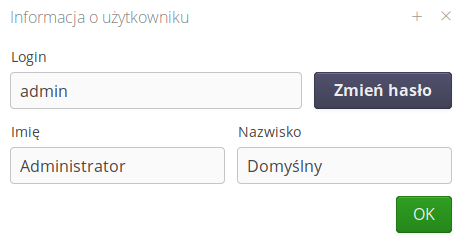
You can change the password from the "Settings" menu. An information window with information about the logged in user will appear.
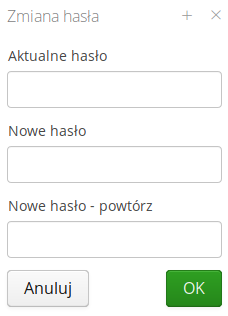
Then, by pressing the "Change password" button, you can change the password for the currently logged in user.
Using the system
After successful logging in, depending on the system settings, an appropriate start window appears. In the case of the energy application, the start window is the view of the current energy generation in the plant. In the sidebar, the user has access to all functions for which he has permissions.
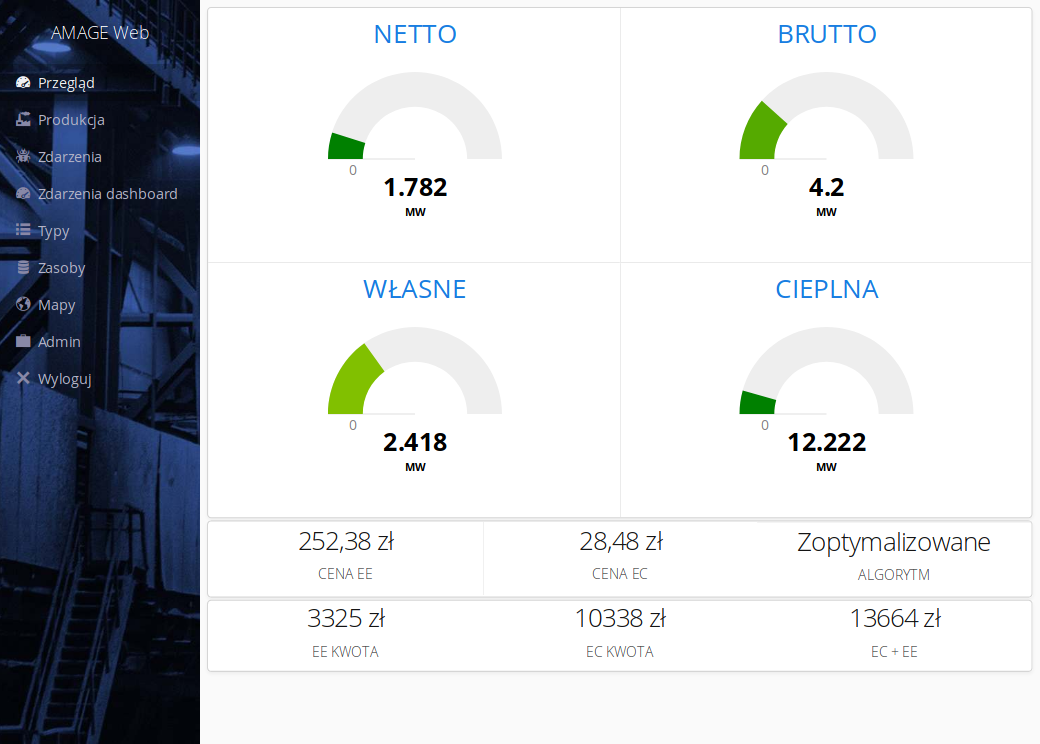
| If the functions to which the user believes he has access are not visible in the menu, please contact the selected System Administrator and ask him to grant the appropriate permissions. |
In the menu under the 'Production' link, an additional visualization dashboard is available. Depending on the configuration of the system, information about key parameters appears on it. If they have already been entered into the production system, the values appear with the description.
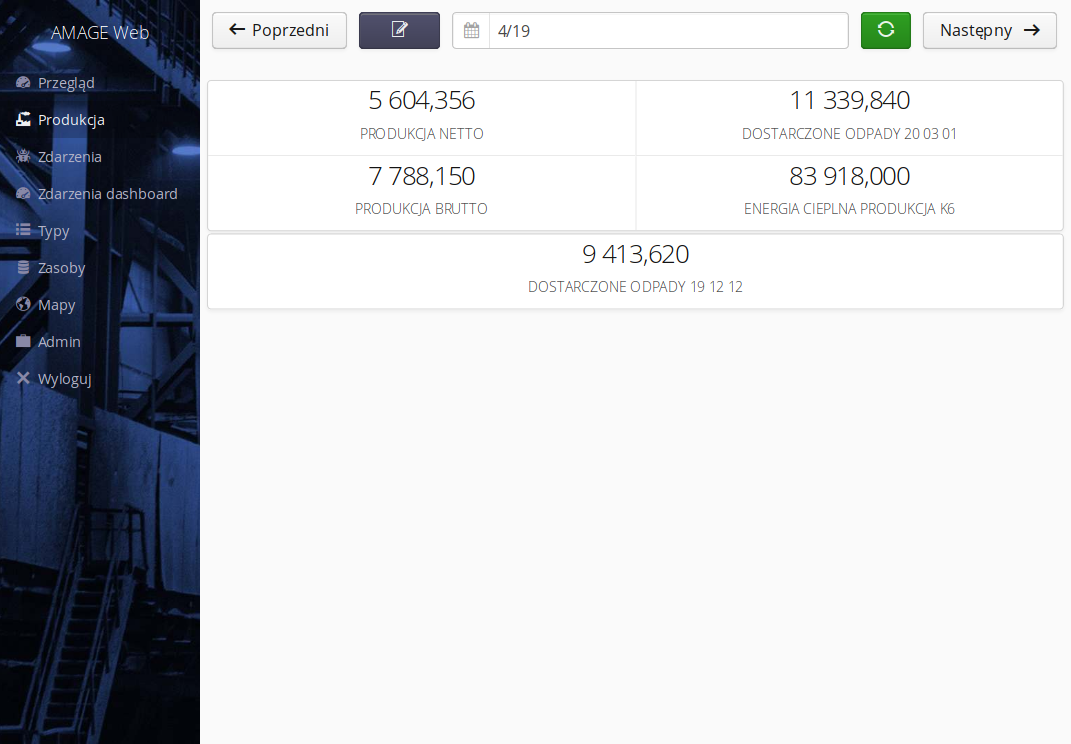
There are buttons on the top bar:
-
To navigate between months. By default, the current month is loaded.
-
to choose a month from the calendar
-
view refresh
-
Move to the detailed monthly view. The button takes you to the details of a particular month.
View of monthly data
When monthly data is selected, the month data detail view is loaded. The data is divided into sections. Each section has its own header, which contains information about:
-
the name of the section in question
-
an icon indicating whether a given section is fully completed (list icon) or a parameter is missing (strike-through icon).
-
background color - if the background color is light, it means that in a given section there is no parameter assigned to the current user that is not entered. Red color means that in a given section the user must enter data.

When a section is selected, it expands and shows all the parameters assigned to it. Each has a value and two buttons associated with it. The value in case a user is responsible for it and has not been entered has a red border. The section also has an edit button for the section in question.
| The edit button can be locked. This means that a given month is locked for editing. Only a person with authorization can unlock a given month for editing. This person should be contacted for such an operation. |
After selecting the information button, a window appears with basic information such as parameters, responsible persons and set limits for the parameter in the current year.
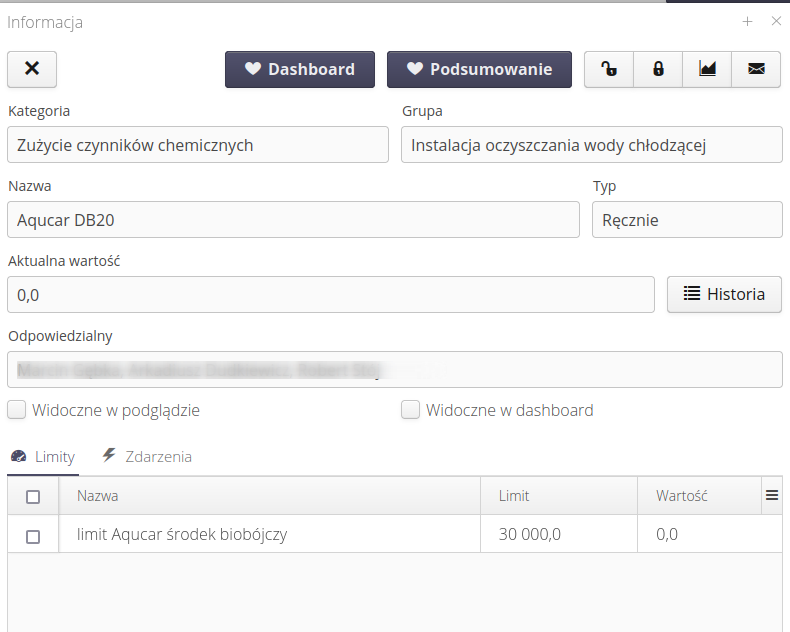
Parameter lock/unlock buttons allow an authorized person to lock parameter modification operations.
Buttons with a "heart" under the names "Dasboard" and "Summary" allow the user to select parameters that are important to him, which will then be made available in dashboards and work summary on a mobile device after selecting "own" data view.
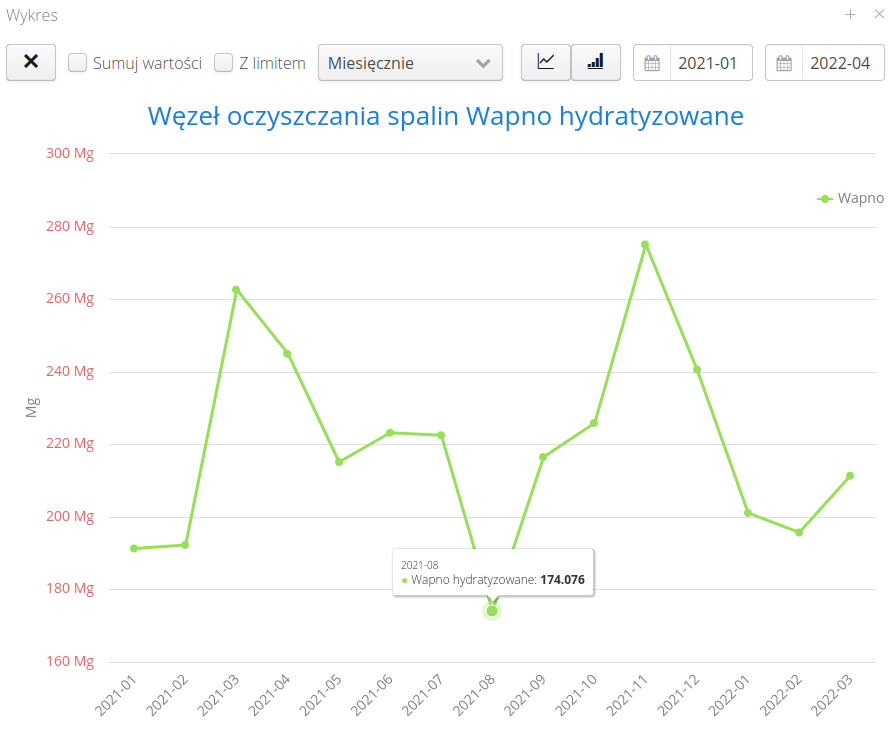
Selecting the chart button opens the chart visualization window. By default, the period of the last year (12 months) is loaded. The chart can be parameterized using the options available in the upper bar of the window:
-
summing - causes monthly summing of entered values
-
period - summation of data over a monthly, quarterly or annual period
-
chart type - linear/bar chart
-
date range for visualization
-
option to display (or not) the limit value for a given parameter.
| Parameters are also available in energy dashboards. New visualization panels can be freely created using dashboard tiles. |
Selecting the "History" button in the parameter details view allows you to display the history of parameter changes. It contains information about the changes made to the parameter. You can also use this view to access the attachments attached to the report and mark the entry as incorrect.
The system treats parameters that are marked as constant in a month differently - then changing the value will overwrite the previous value. Parameters marked as increased allow to add by means of successive entries of the main value. This is useful in the case of parameters that change (increase) during the year by subsequent entries. An example is the parameters, e.g. from weighing systems, where each entry is another vehicle that has passed through the scale. The weighted values are added to the monthly parameter.
|

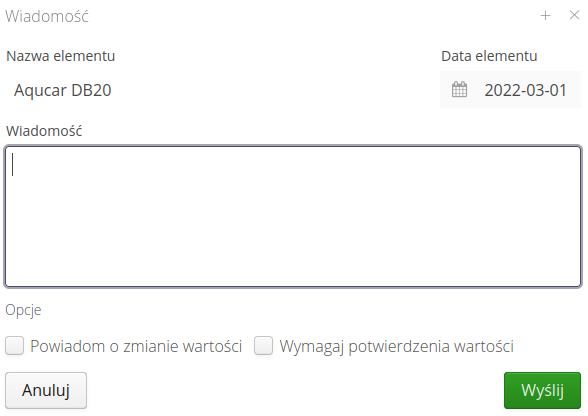
In the parameter details view, the email button is also available, which allows you to send information to assigned persons and enable additional result options for this notification. This action is used by the person verifying the data to remind about data entry, notify about a data registration error, etc.
Options available:
-
Notify about value change - after sending a notification by person X, this person will be notified by a separate email when the parameter value is updated (once). This allows you to notify the assigned persons and then the system will remind the coordinator that the data has already been entered. This speeds up the action.
-
Require value confirmation - the operation allows you to call the value confirmation action. It is used when the coordinator finds suspicions about the values and asks the persons responsible for confirming these values - everything is done electronically in the parameter details view.
Entering my data
To start entering data, in the month view, select the 'Edit' button in the selected section. A window with the parameters entered for the given section will appear. Parameters that a given user is obliged to enter have a red asterisk and are editable. Parameters to which the user has no access are locked. If a given parameter has not been entered yet, information about the data format template to be entered is displayed instead of the empty field, e.g. for the time value HHH:mm and for the number 0.000.
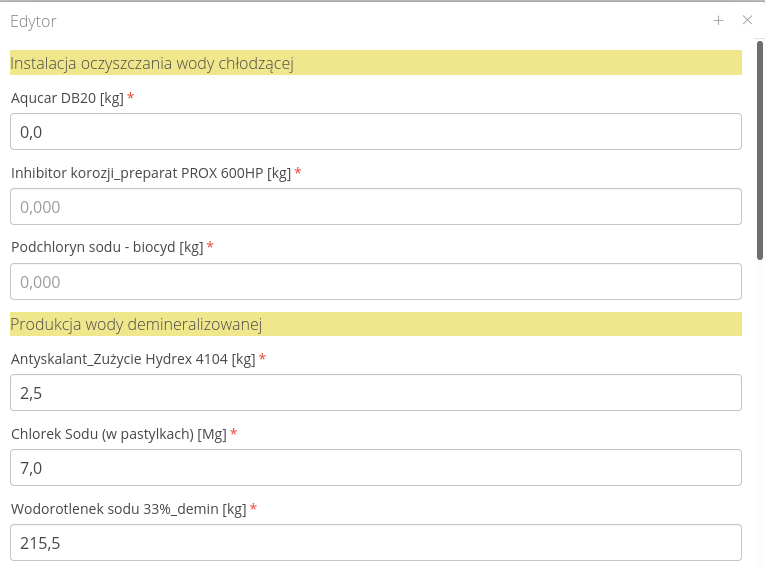
The system automatically verifies the correctness of the entered data by marking a given element in red if the entered data does not correspond to the type of a given parameter, e.g. entering hours where a number was expected. After entering the data and confirming it, we go back to the selected monthly view.
Deficiency notifications for the month
The system automatically notifies users by email when data has not been entered into the system. Automatically, according to the settings, the system at the beginning of the month sends information to selected users about the lack of entered data, along with a list of parameters that have not yet been entered by the user.
| The Howto is based on system version 1.17.0.2 (03.2022) and presents features that may not be available in your system. Ask AMAGE about making this functionality available. |
| Due to ongoing development of the system, some screens or configuration files may look slightly different, but will still retain the full functionality described here. This does not affect the core functionality described in this document. |