Service events
Service events
Service events are available in the system menus in the 'Service' area. They provide action views of the service request list and dashboard with data visualization.
List of service events
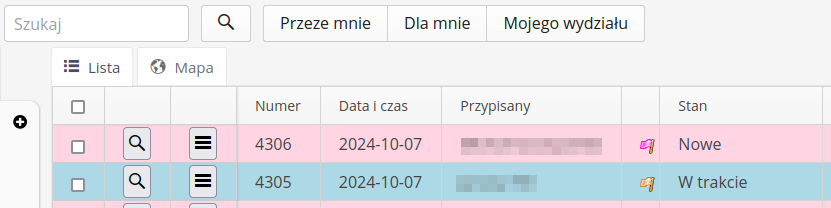
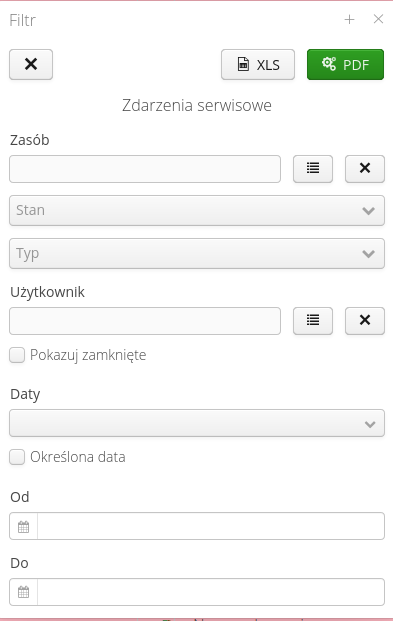
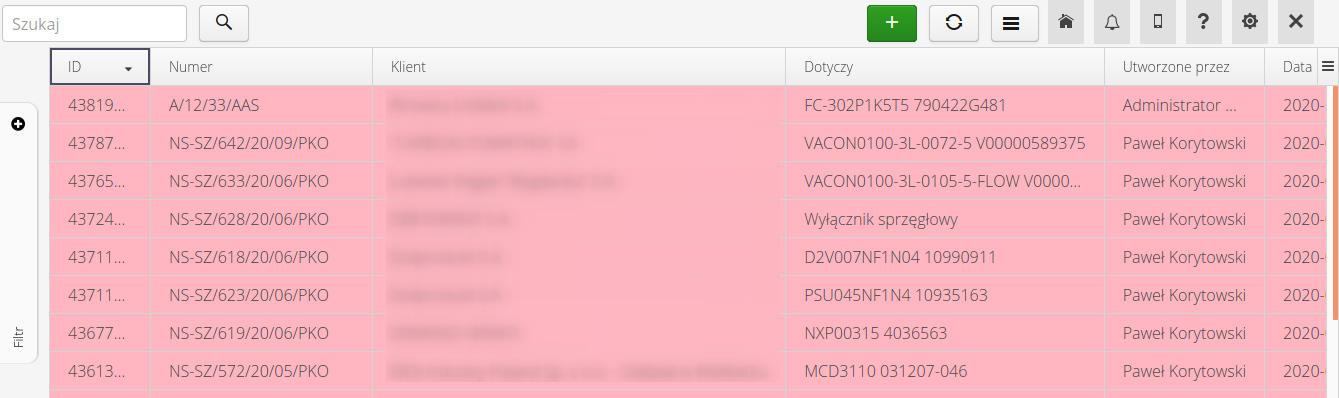
The list of service events shows all events currently stored in the system. From this view you can add a new event or generate a summary report for the visible events. The view shows all service events in the form of a table. The colors correspond to the generalized state of the event: new/in progress/completed, which are specified in the definition of each event state. The list contains basic information about the event, status and total cost of items from the warehouse and external services.
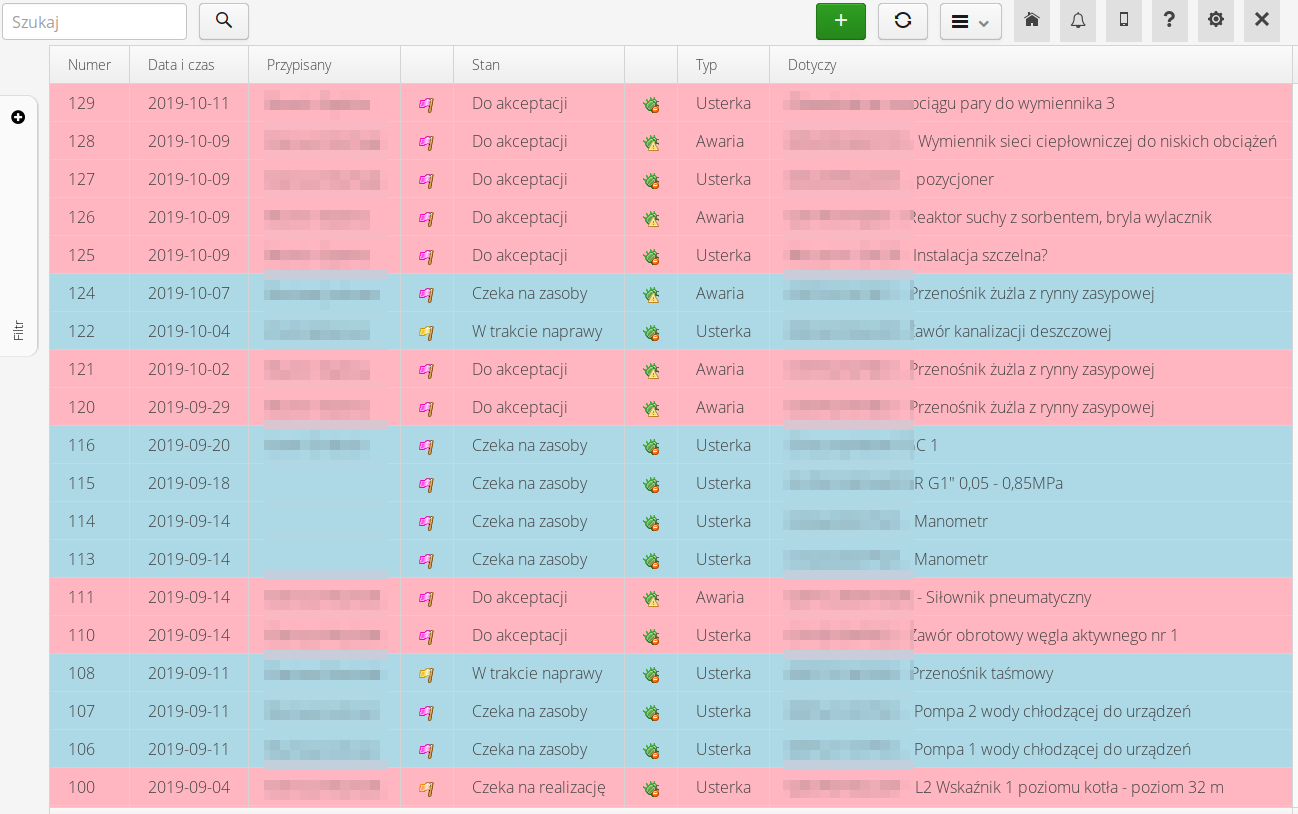
By using color definitions in the types and states of service events, we can visualize detailed events with coloring and marking using codes of states and types of service events.
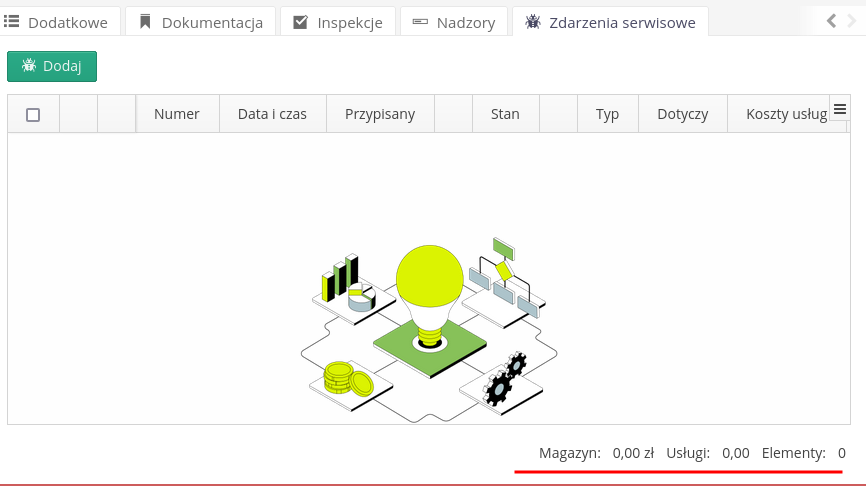
In the case of an instance with the warehouse module enabled, information about service and warehouse costs for visible (active) service events appears at the bottom of the window
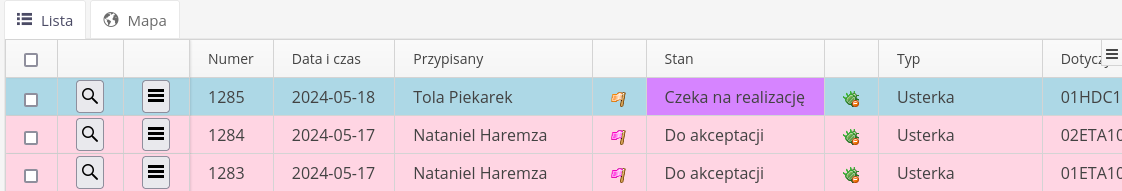
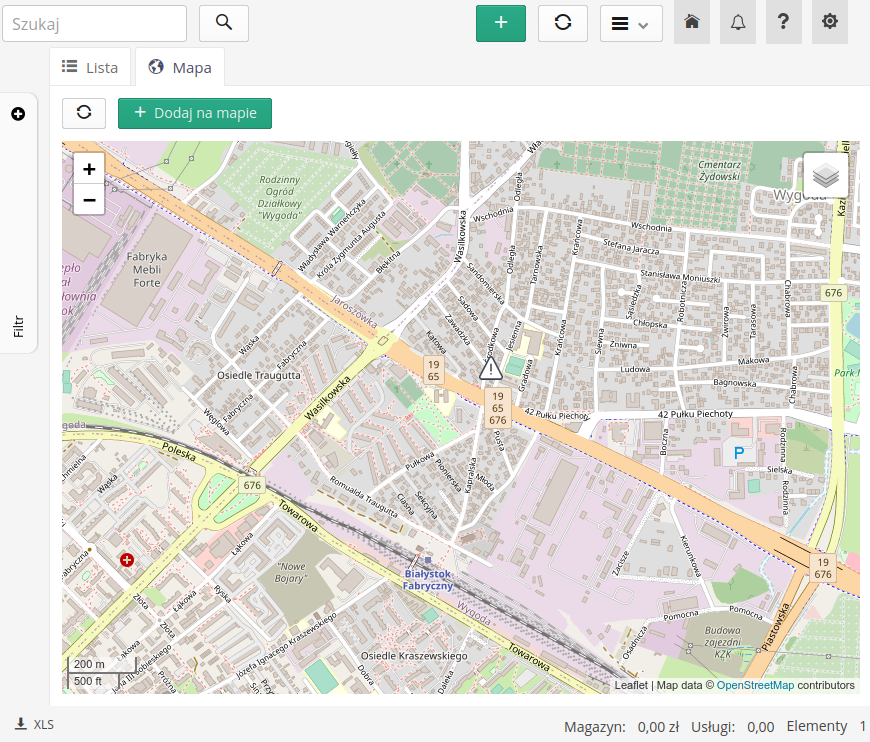
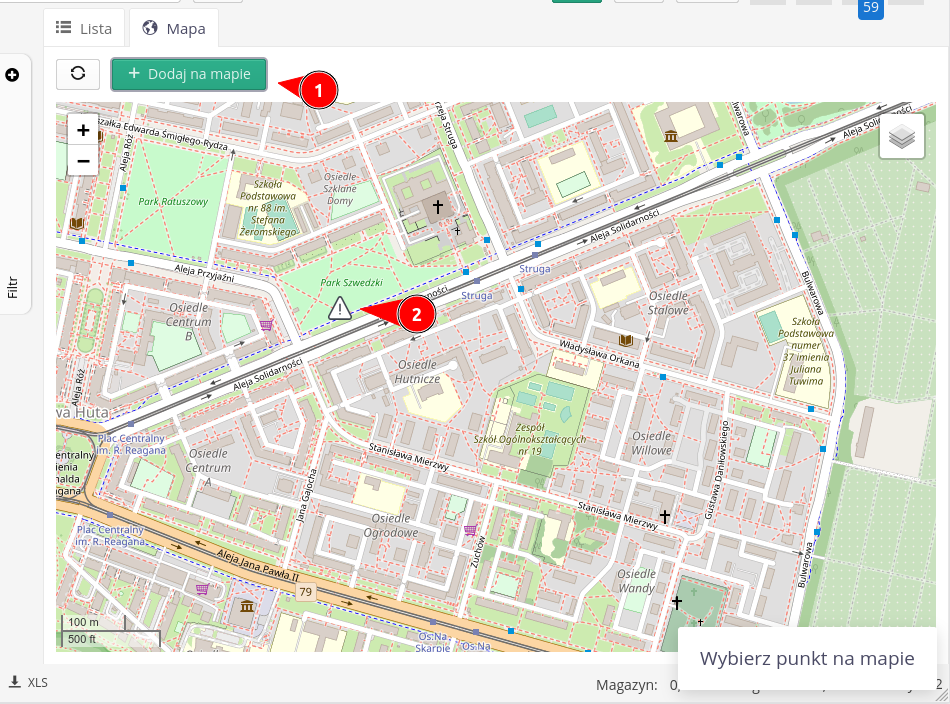
The data view can also be presented in the form of a map. After selecting this tab, service events with their geolocation are shown on the map.
The main toolbar contains a text filter that searches for data based on the text provided. Additionally, there are three buttons that allow you to quickly display service events:
-
By me - created by me (currently logged in user)
-
For me - assigned to me
-
For my department - service events that are assigned to all employees of my department. If I do not have an assigned department, then all tickets assigned to users who do not have an assigned department are shown.
| The settings for the above buttons are saved for a given user after they are selected. They will be recreated the next time you enter the view if you do not have any other filters set. |
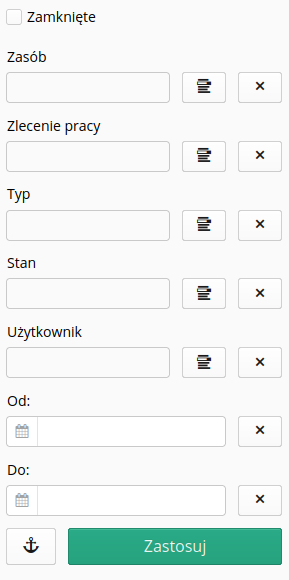
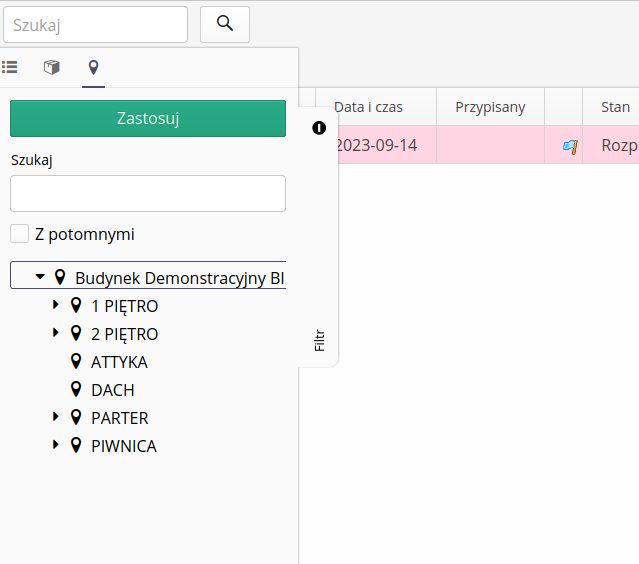
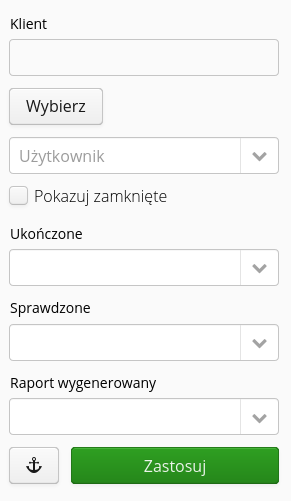
A filter is available on the sidebar, which, when expanded, allows you to filter events according to state, type or assigned person.
In the case of an instance intended to service multiple clients, additional information appears in the filter allowing you to select the data entered for customer service.
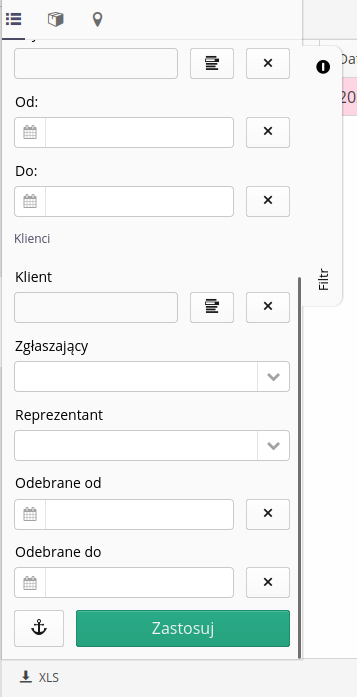
Additional tabs in the filter allow you to display and filter by location tree or list of product groups in the system.
| Users' view and list of service events may also depend on permissions for specific service event types/states if the visibility restrictions based on permissions deployment flag is enabled. |
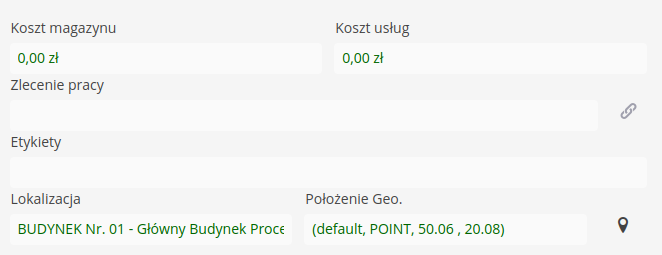
After selecting a service event, we go to the details of the event. In the view we have information about the parameters of the event, the list of available stocks to select and change, the total cost of items from warehouses and services. Actions to add a comment, service. Editing the event (for example, changing the device due to an error during its creation) and deleting the event. All actions require appropriate permissions.
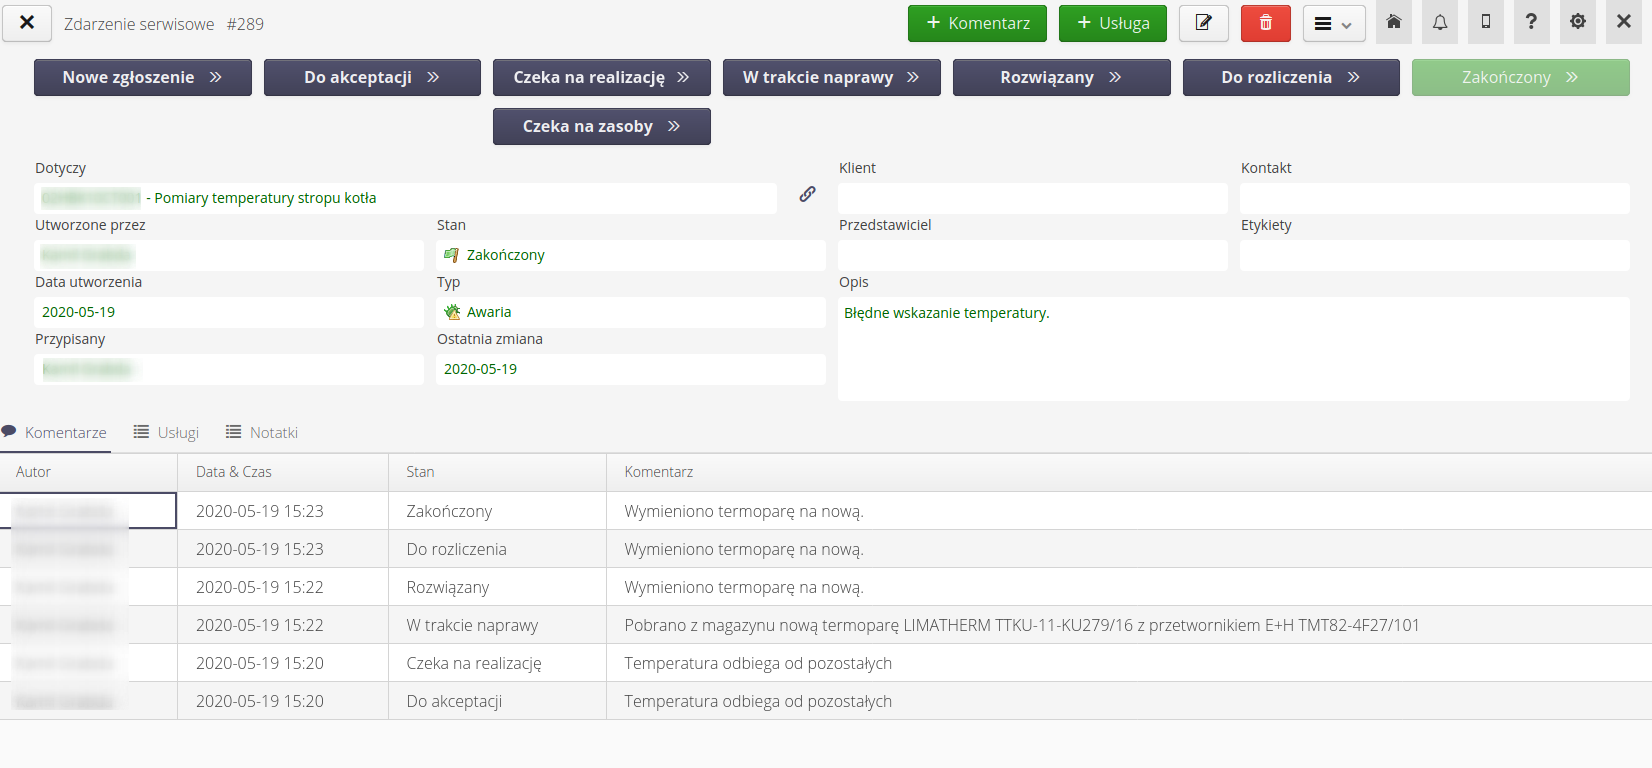
In the event view, we can also see the exact location of the request (if it was entered during registration). With its help, we can accurately determine the location of a given event. Using the Marker button, we can display the event on the map.
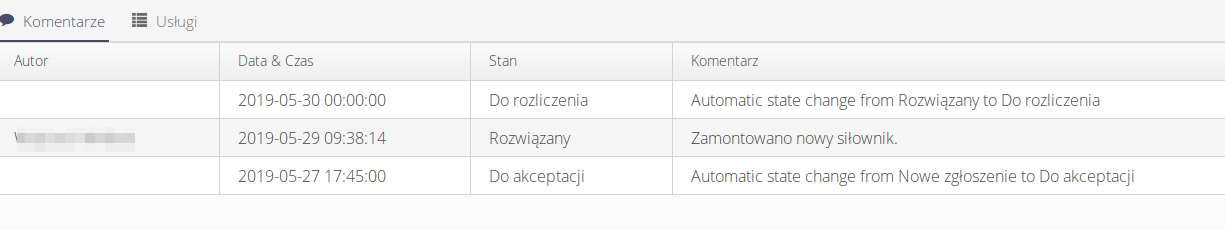
In the secondary menu, we can generate an event report and save/print it. In the event view at the bottom, we have access to a list of comments and a list of services entered for the service event. In the additional text, information about the total cost of services and items taken from the warehouse appears.
Creation of a new event
Choosing to create a new event opens a window where you select the device (resource) to which the event applies, the type of event, the description, and select the person assigned to the event.
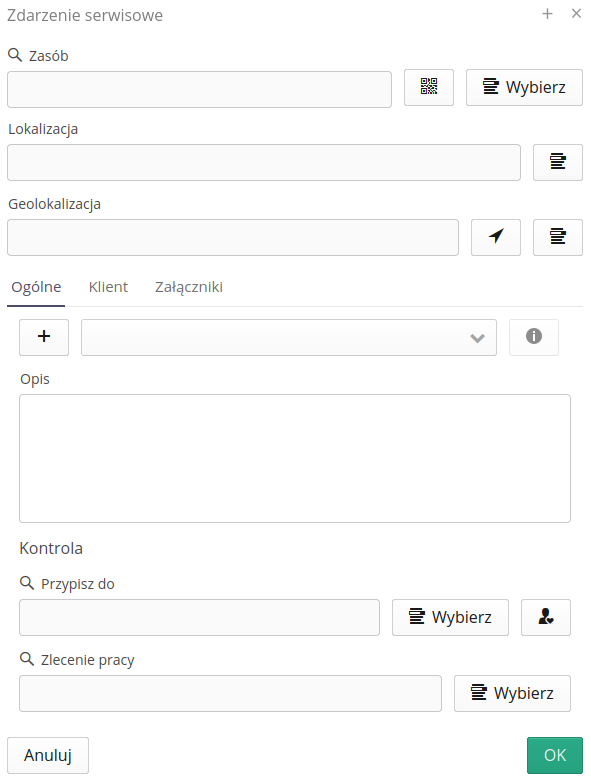
Using the (+) button, you can add a new type of service event directly from this view. This is only possible for people with appropriate authorizations.
The 'Attachments' tab allows you to add attachments directly when adding an event.
The list of resources allows you to filter resources and select the appropriate device, to assign an event to it.
We may also determine the location/geolocation of the request. These data can be specified interchangeably, i.e. we do not have to provide the device that concerns it in the application, but we can use the location to initially determine the location and then supplement the data (if necessary).
A comment to a report allows you to add a comment, change the status, change the assigned person, or create an electronic signature.
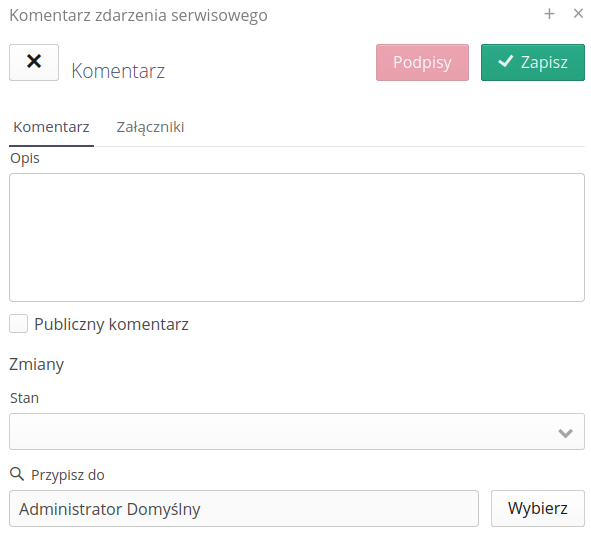
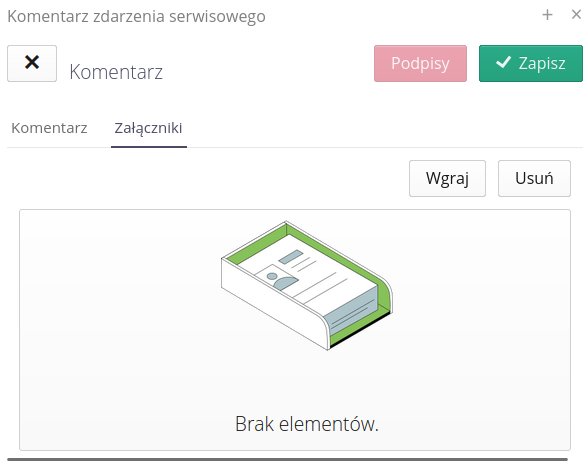
From this view, we can also add attachments that will be attached to the main report and this information will be included in the comment.
| If a device cannot be found, there is an option to create an event without the selected device, or you can switch to the view of creating a new resource and supplement the database with additional information. |
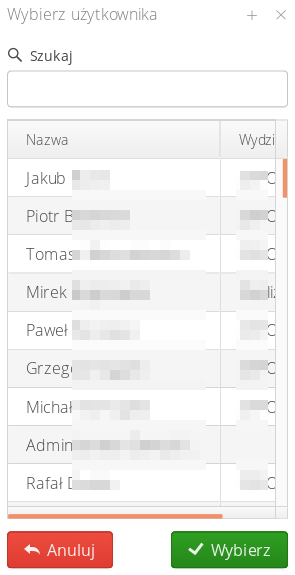
After selecting the list of users, a window appears where you select the person to whom the event will be assigned. He or she will be notified that the event has been created (with the appropriate event configuration in the extended application).
Each submission is numbered using an automatic counter that is configured for that document type. Configuration of automatic counters is possible in the configuration section of the system. After navigating there and selecting Main → System and the Counters tab, we can choose which counter will be used to generate a given document type.
We can also add an event directly from the map view. After selecting the 'Add on map' button, we can select any place on the map and an event will be created with such a location assigned.
Services
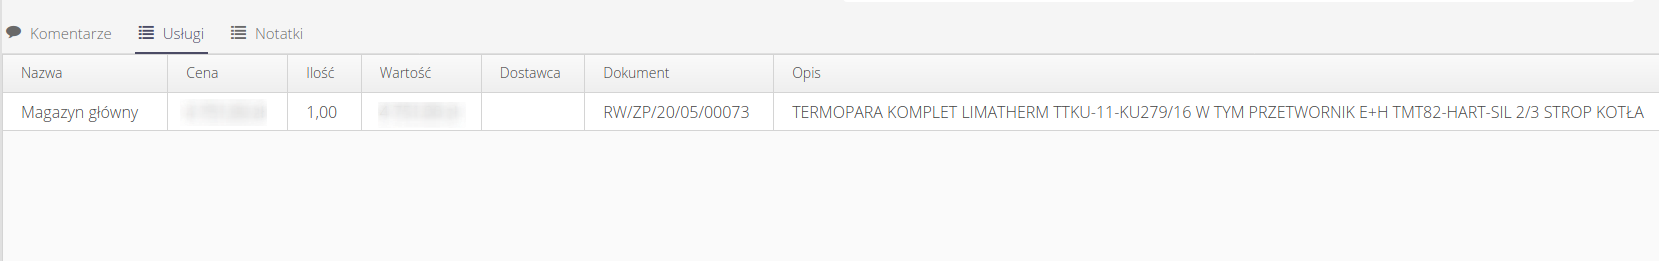
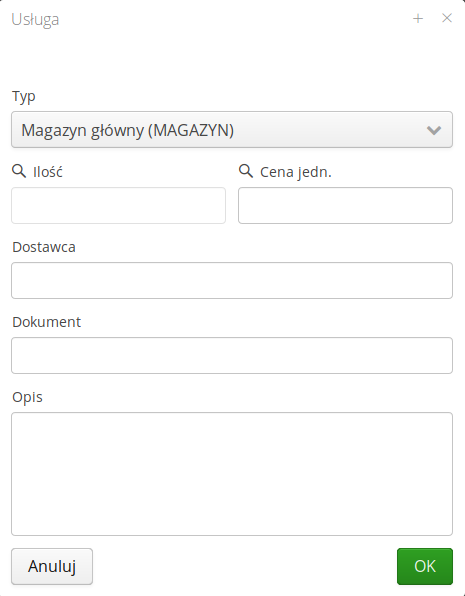
The services mechanism is used to enter additional information about the external costs of an event. The service categories are definable and can be, for example, external invoices, warehouse documents or hours worked on an event. We define the types of service categories in the extended application. In this view, we select only the type of service and enter information about costs, etc.
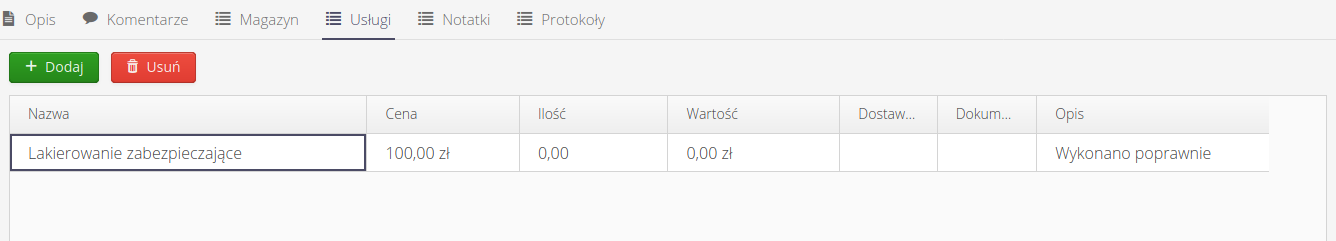
Once a service is entered, information about it is available in the list of services from the event.
| It is possible to integrate the services mechanism with external accounting/warehouse systems. In such cases, after integration, it is enough to mark the cost on the invoice or warehouse document with an event number, e.g. #123, and the AMAGE system will automatically retrieve the cost from the external system and include it in the services. |
Warehouse consumption
Stock consumption introduces the possibility of accounting for stock items in the course of ongoing service work. The list of warehouse consumption is presented in the details of a given service event. It is possible to add items from the warehouse to a given event and subsequently settle them.
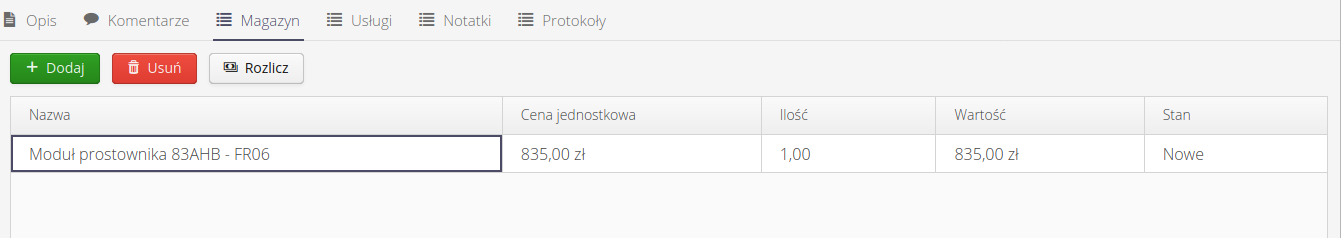
Warehouse settlement is carried out in a delayed manner, i.e. at the beginning the user reserves the items in the warehouse. This information appears in the system. When the service work on a given service event is completed (at the moment of changing the state to a set state), the clearing status of elements on the warehouse is checked. If they have not been settled then there is no possibility to move to a given (final) state. Clearing is accomplished through the dedicated Reconcile button, which causes the creation of stock documents for the reserved items and their final clearing on the warehouse.
| This approach allows more/types of parts to be taken from stock than will actually be consumed. This allows you to complete a service trip with all potentially needed parts and to account for only those parts that are actually consumed. |
Adding stock consumption is realized by the action of the Add button.
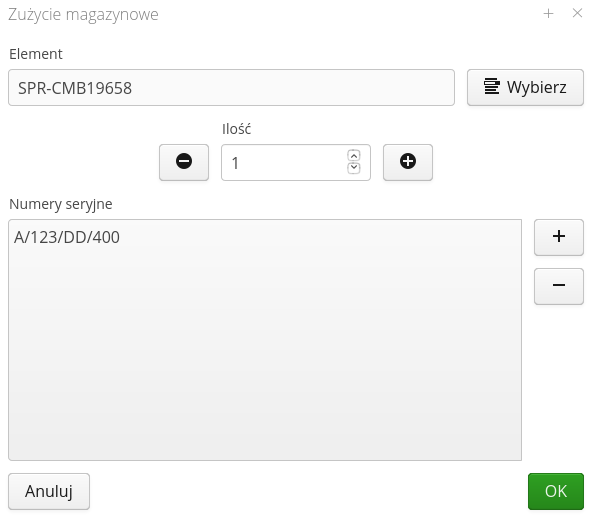
When adding stock consumption, we specify the number of items retrieved and their serial numbers (this information will be in the summary information for billing/reports).
Configuration
The configuration of service event types and states is explained in the system configuration section. See more in:
Configuration flags
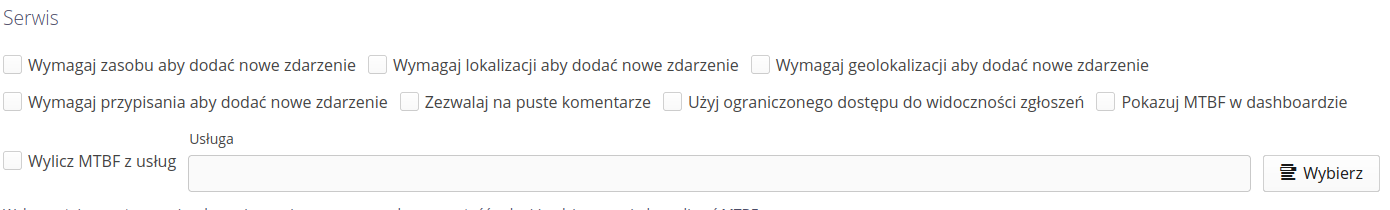
There are also configuration flags available in the system configuration section, which allow you to customize the system’s behavior. Configuration flags available for service events include:
-
Require a resource to add a new event - forces you to select a resource when adding a new event
-
Require location to add new event - forces you to select a location when adding a new event
-
Require geolocation to add new event - forces you to select geolocation when adding a new event
-
Require user assignment to add new event - forces user selection when adding a new event
-
Use restricted access to ticket visibility - use restricted access to filter the view of tickets that users have access to
-
Allow empty comments - allows you to add a comment without any content
-
Show MTBF in dashboard - shows MTBF indicator in dashboard
-
Calculate MTBF from value logged in services - indicates which parameter from services should be used to calculate MTBF
Expanding data on external customers
The system has the option of operating the service events module in the context of external clients. These can be separate departments in one company, but also external clients for the company that performs such work. Enabling this option in the configuration flags allows additional information to be registered.
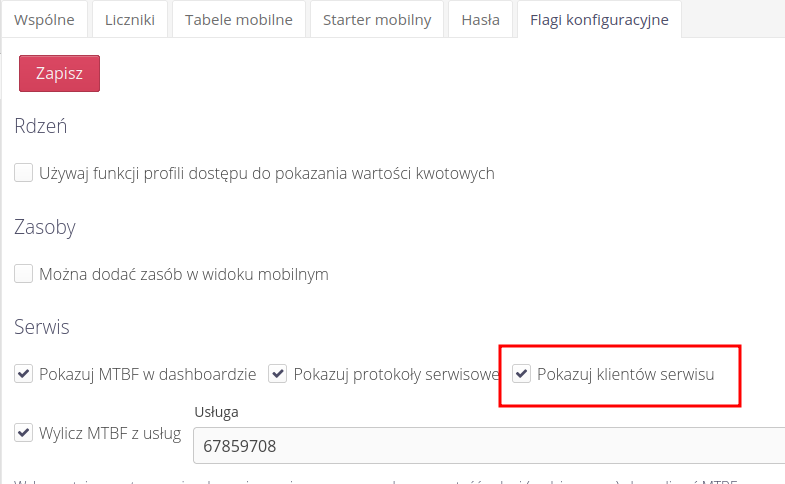
When creating a service incident, an additional Customer tab appears, in which we can define a number of additional information to identify the customer and save the data necessary to perform these tasks.
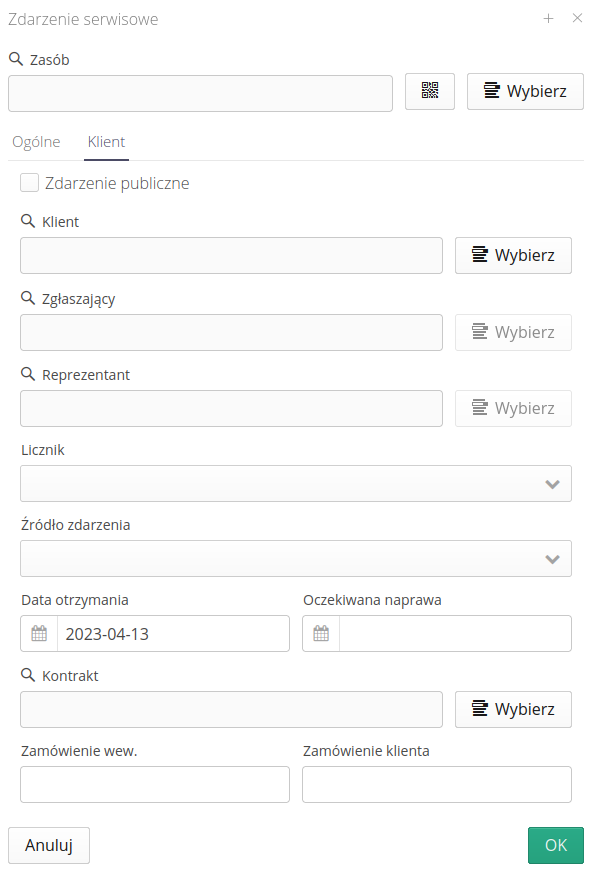
This additional information also appears in the service event details view.

| Additional data can be used in service reports, which, after defining additional data, will display all the necessary information to carry out these works. Please refer to the Report Creation documentation for access to all service report fields. |
Dashboard of service events
For authorized users, the application has an administrative view dedicated to computer screens. In it you can view information about all service events and a dashboard with data visualization
The dashboard for the desktop interface shows statistical information (numbers of requests, types of requests) but also reliability indicators, statistics on the number of requests per device and type, and the number of requests in the last 12 months.
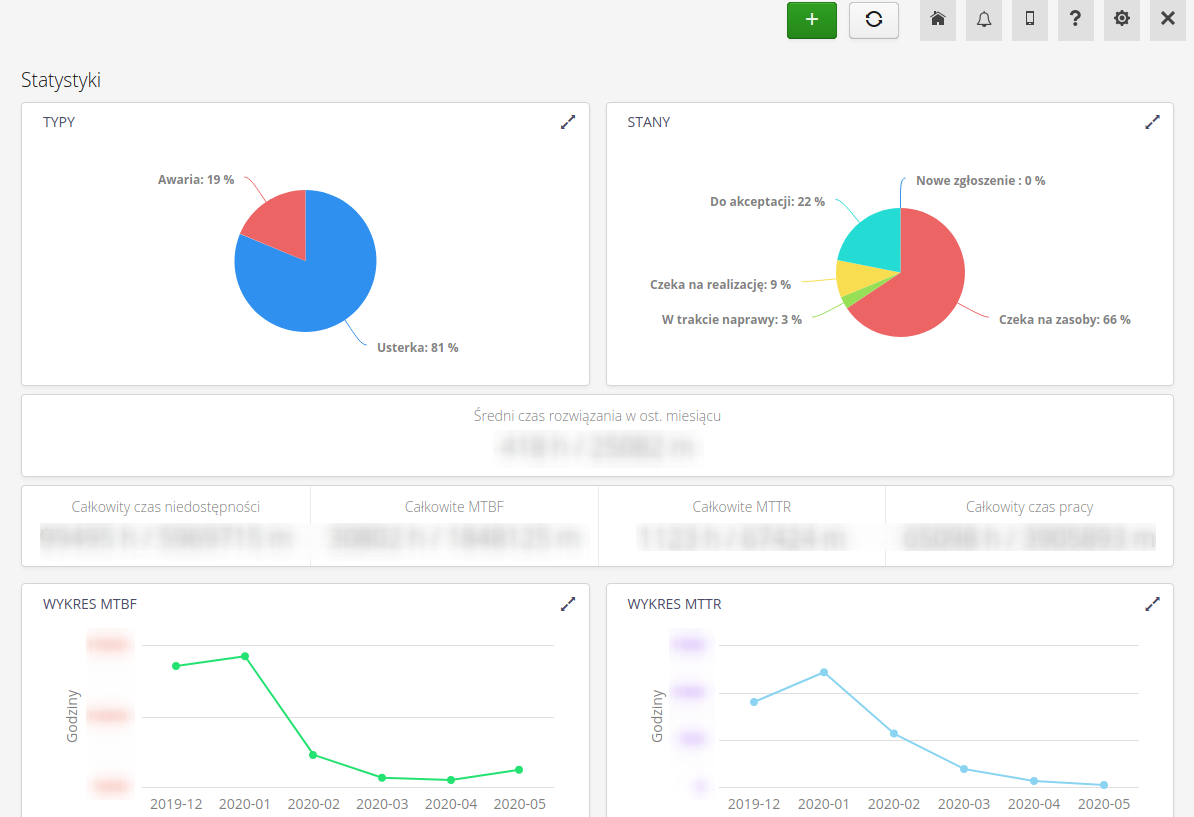
Additional reliability data specifies information on work in progress and its timing. We point out/list:
-
Average time to resolve an incident in the last month
-
Total unavailability time (for reportable devices)
-
Total MTBF, MTTR
-
Total working time
-
Graphs of MTBF and MTTR values over the last six months
| Reliability calculation information is defined during system implementation. The visibility of this panel is configurable. The way the parameters are calculated depends on the configuration and can be based on the times of change of service request states or on the record of the time of work performed through services in the system. |
Additional analytics
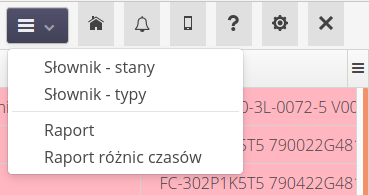
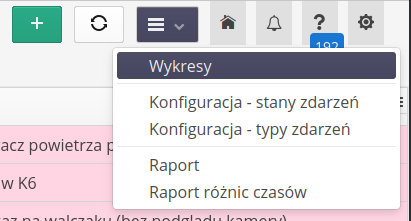
Additional analytical charts and statistics are also available, which allow you to analyze service requests by department, request type and type category. The view is available from the tool menu in the service request list view.
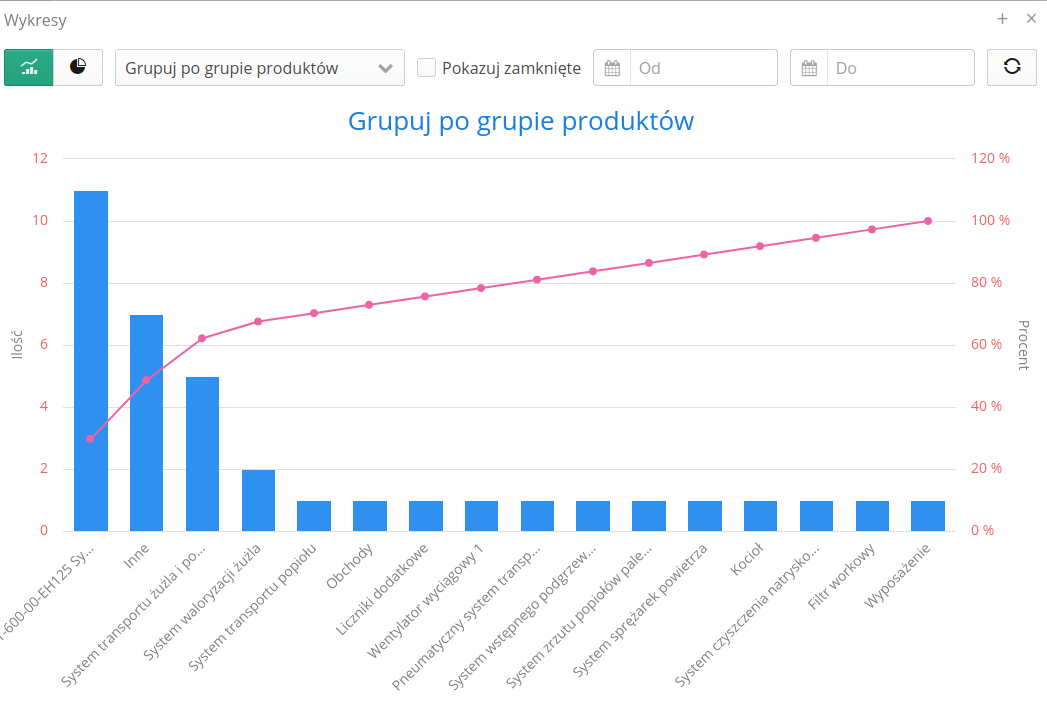
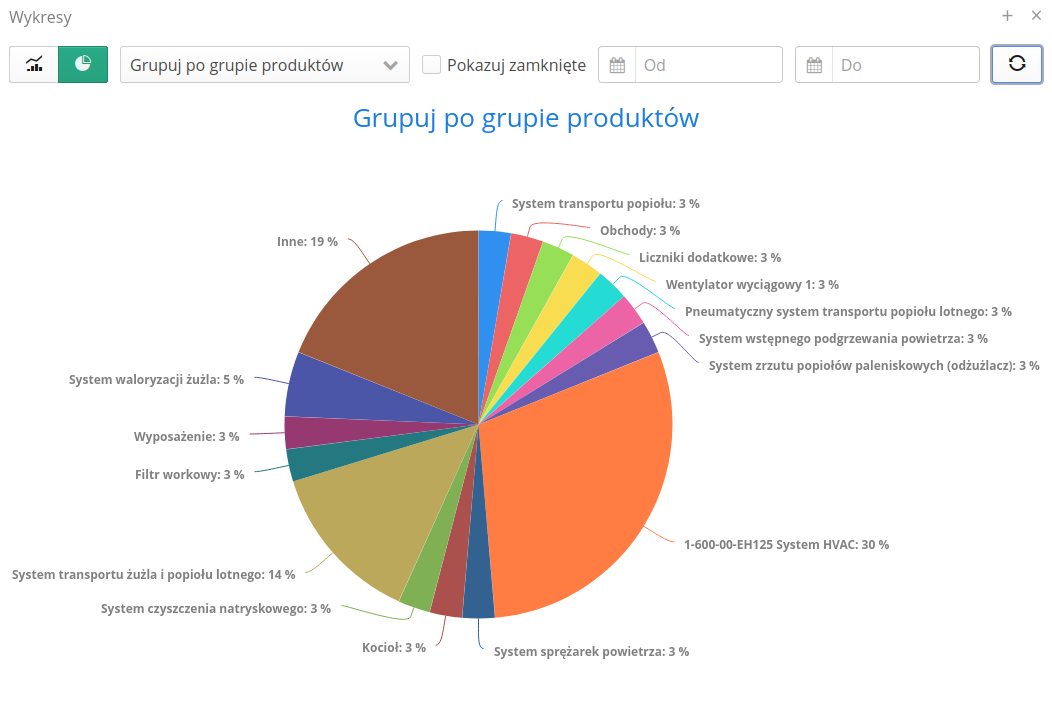
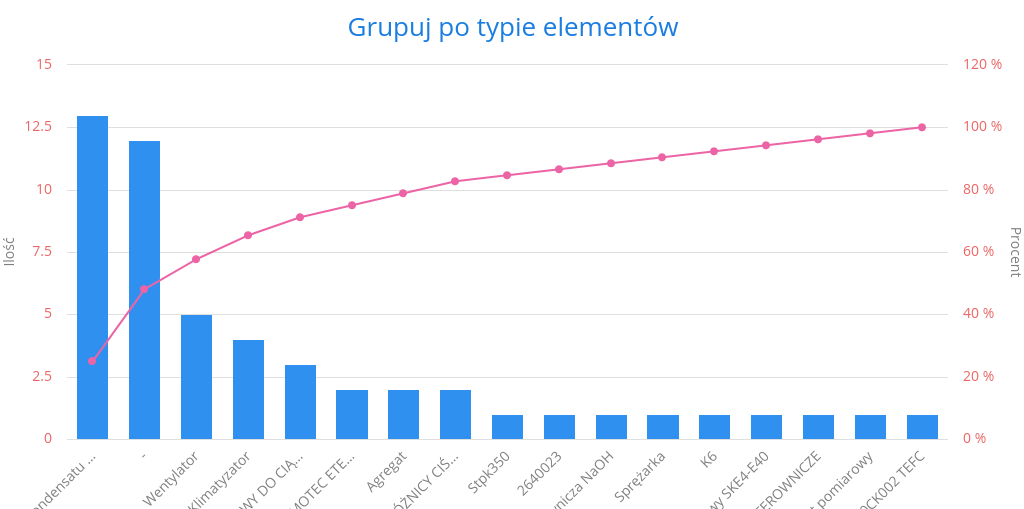
In the statistical charts view for service events, the ability to display Pareto analysis according to many different search criteria has been added. Using this chart, we can analyze service calls and identify the most common problems.
Service protocols
The service protocol is a detailed description of the service activities performed. A service event, usually resulting from a customer/user request, contains basic information. It can be handled through the usual service event workflow process. The service protocol is usually an additional component of the service event, which collects all executive information about the work carried out, costs, participants and other data.
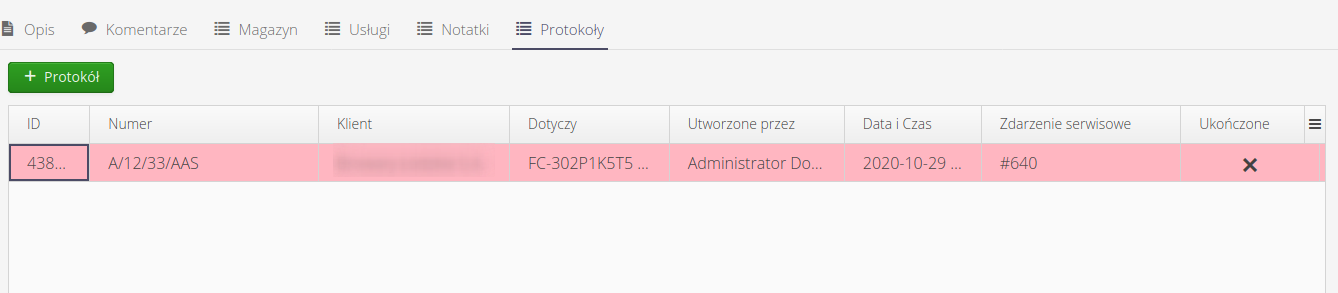
By default, after entering the list of service protocols, the user is presented with a list of all active service protocols implemented in a given system.
The user has the option of additionally filtering protocols against the client, the user handling the protocols or showing already closed protocols and filtering by execution flags.
After selecting any protocol, you go to the protocol details view. This view is divided into two parts. the upper one contains basic information about the protocol. The lower one is lists of related costs/services and additional information.
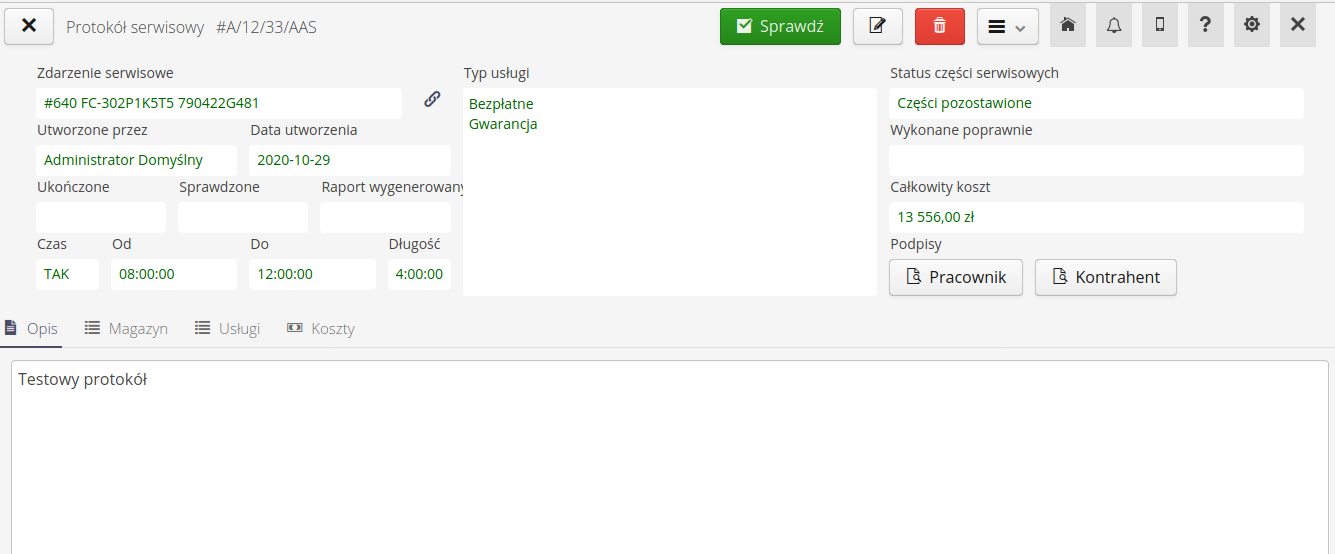
In the details of the protocol, we present information about the related event, the client, the type of service performed, the completion date, the aggregate costs, and information about, for example, the signatures of those performing the protocol. In the lower part there is a detailed description of the work performed during the execution of the service work.
Additional tabs provide information on warehouse consumption. Stock consumption allows you to assign specific stock releases to a service protocol, along with specifying the serial numbers of the equipment that was installed during the work.
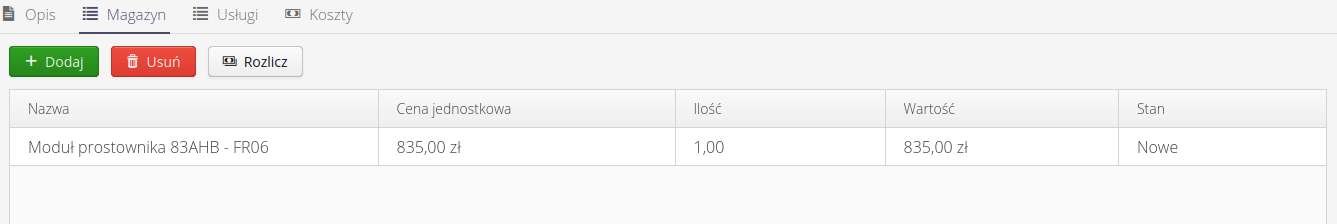
Warehouse consumptions can be added/deleted which increases/decreases the numbers of reserved quantities in the warehouse accordingly. Once the protocol is completed, the warehouse consumptions should be accounted for by creating the corresponding warehouse releases. Only then does the stock balance change.
| This approach allows you to take more items from stock and, after repair, return the items you haven’t used (excess/stock). |
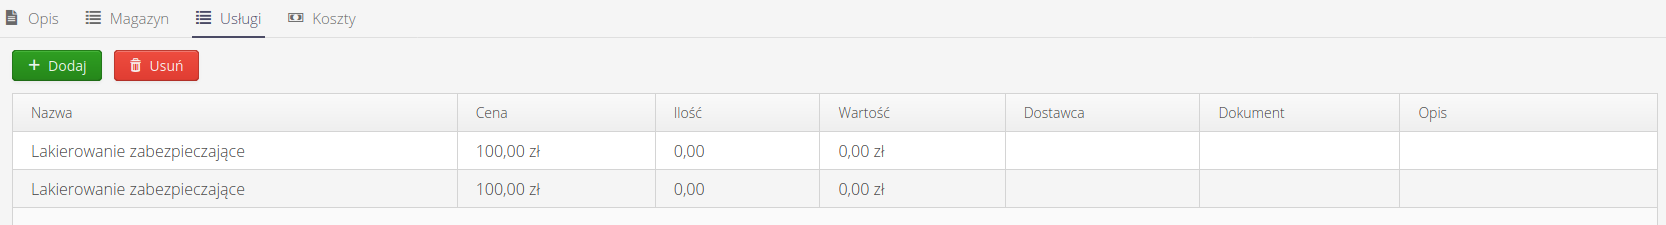
The list of services allows you to define the services associated with the activities covered by a given service protocol. This data will also be included in the protocol report.
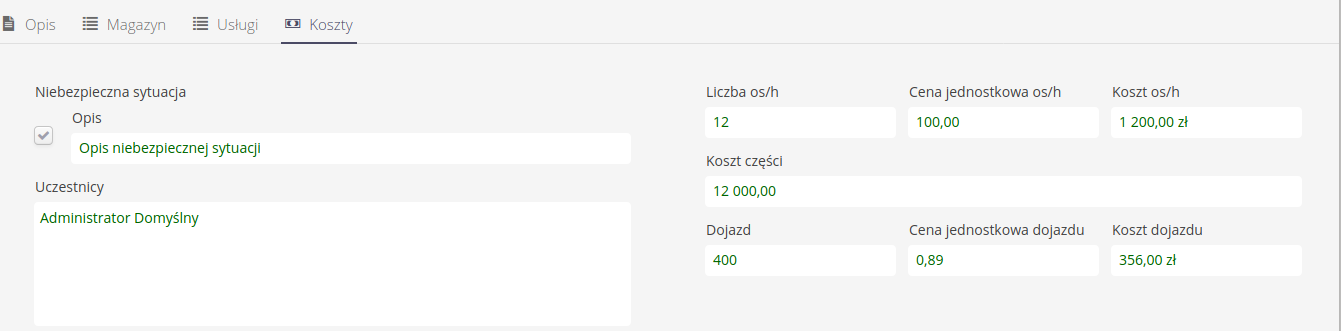
Additional information on detailed costs, participating persons is provided in the costs tab. It contains other remaining information necessary for the full settlement of the service protocol.
For protocol details, actions are available in the context menu.
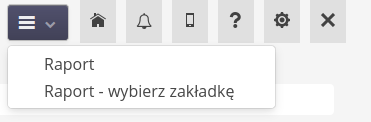
Available actions:
-
Protocol generation - generate minutes in PDF form for printing/sending to external parties
-
Generation of protocol from bookmarks - generate protocol with selection of report bookmark to customize appearance
During the generation of the protocol report, the user is presented with options to select the sections displayed in the report (if the default report appearance is used).
Adding/editing a service protocol
Adding/editing a service protocol allows you to enter all the necessary information about the protocol. The data is divided into sections: Common, Cost, Other, Warehouse & Services.
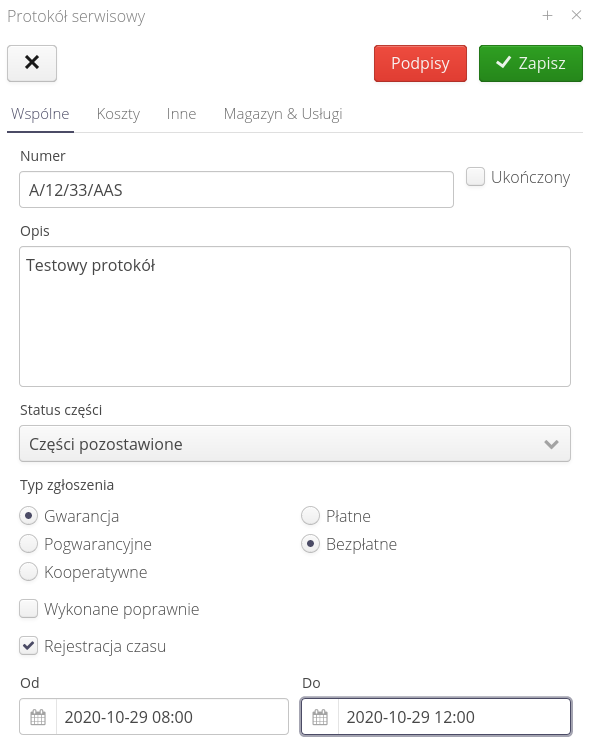
Available options in the common view:
-
Number - protocol number
-
Complete - whether the protocol is completed and ready for inspection
-
Description - description of the protocol activities.
-
Part status - status of the part during repair (left, taken).
-
Filing type - cost and performance filing type.
-
Performed correctly - whether performed correctly and no further intervention is required.
-
Time recording - recorded repair time.
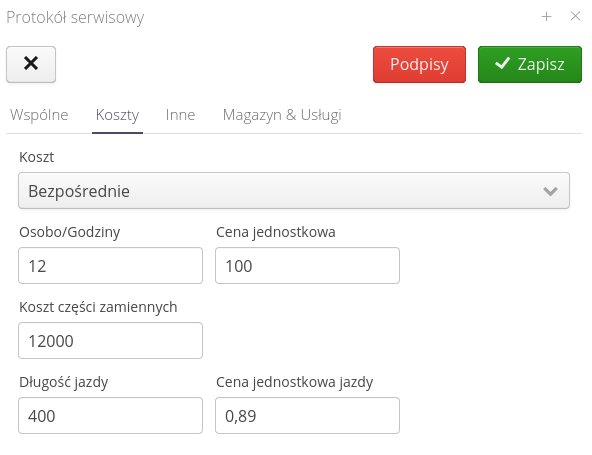
Available fields in the cost view:
-
Cost calculation type - cost calculation type (given directly, calculated).
-
Person-hours + unit price - number of man-hours + unit price.
-
Cost of spare parts - cost of spare parts.
-
Length of ride + price per km - length of ride and rate per km.
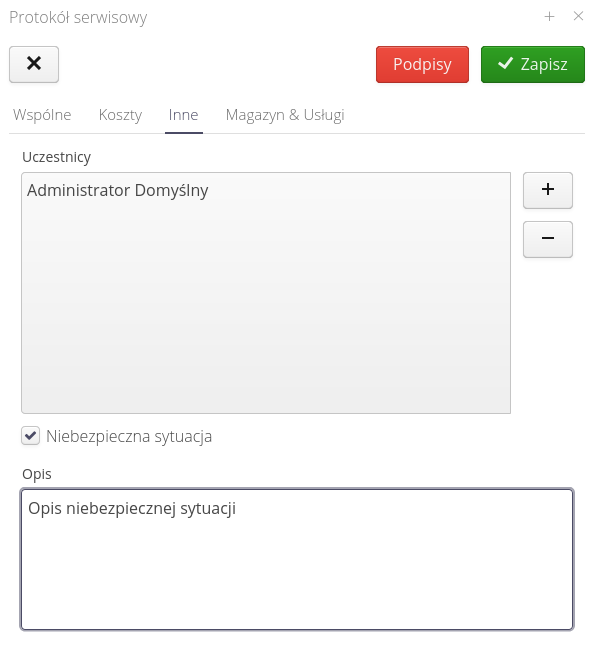
Available fields in the Other view:
-
Participants - a list of participants in activities related to this protocol. They will be included on the report
-
Dangerous situation + description - whether a dangerous situation occurred during the repair work and a description of this situation.
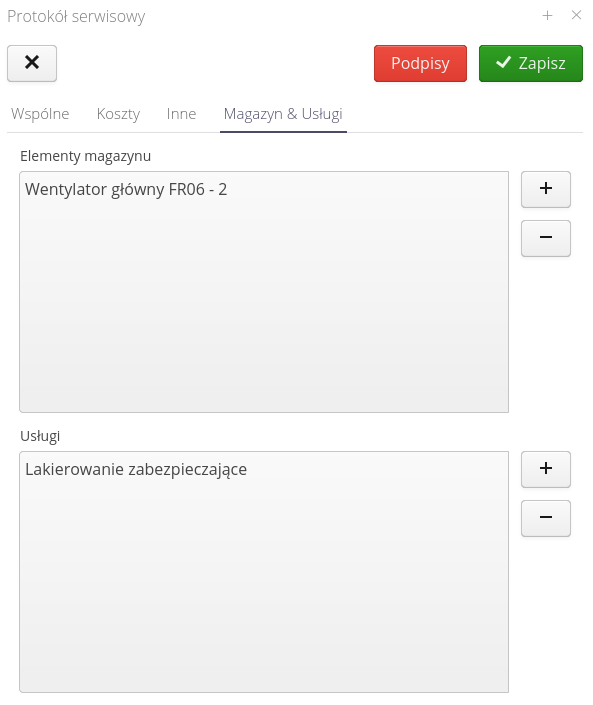
Available fields in the Warehouse & Services view:
-
Elements taken from stock - list of elements taken from stock
-
Services added to protocol - a list of services plugged into a given protocol.
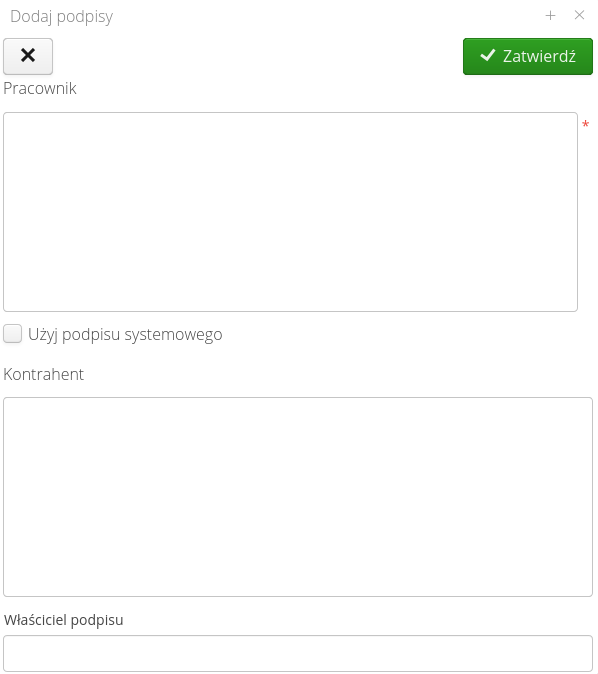
If signatures are indicated to be required for the protocol, the Signatures button will be red until the signatures of the contractor and/or contractor are not affixed to the protocol.
Each service protocol is numbered using an automatic counter that is configured for that document type. Configuration of automatic counters is possible in the system configuration section. After navigating there and selecting Main → System and the Counters tab, we can choose which counter will be used to generate a given document type.
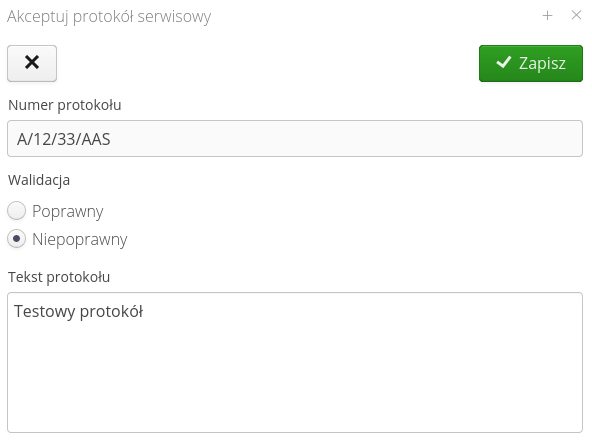
Acceptance and verification
In the details view of the service protocol, the procedure for checking the protocol by the person coordinating such work can be performed. Calling the option is possible in the action of the given service protocol Check. Calling it displays a window with the possibility to enter data and mark the execution status of the protocol.
| If the protocol has unaccounted for warehouse consumption (i.e., not removed or approved as warehouse releases) then the system will not allow you to perform a protocol check. |
The protocol can be generated into a PDF report. All data entered into the protocol appears on the report.
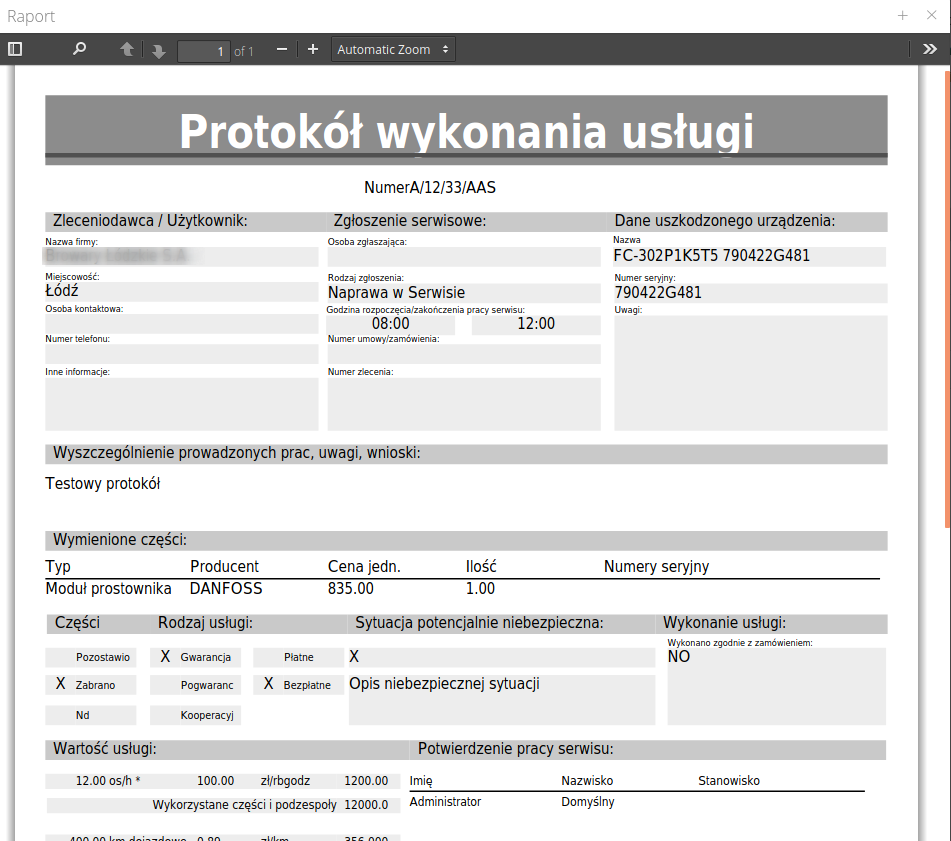
| Through the definition of reports in the configuration module and report tabs, it is possible to customize the appearance of the report according to the requirements of users/customers. |
| There are automations in the system that allow you to automate some of the work such as generating reports, sending reports to customers, etc. Details are available on the Help Portal in the How to do section |