Leases
Leases
The objects and construction elements area includes an extension of the functions of the 'Work Structure' area with functions and tasks dedicated to construction areas. The functions organized in the 'Work Structure' menu and the 'Work Orders' element include functions and data views to facilitate construction site work.
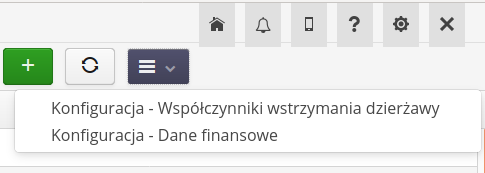
In the summary view of work orders, the following additional operations are available in the context menu:
-
Access to configuration of lease hold factors
-
Access to financial data configuration (FRI data, etc.)
Additional actions specific to the lease areas appear in the work order details.
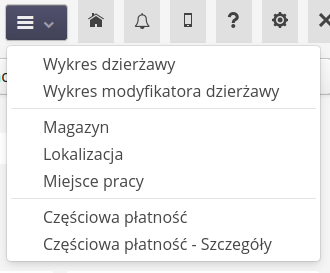
Available actions:
-
Lease/modifier lease chart - access to charts
-
Warehouse/Location/Workplace - ability to go to the warehouse or places on the map associated with a given construction element
-
Reports - access to generation of financial/analytical reports
Editing a design element is divided into two areas:
-
edit basic work order information
-
editing lease-specific data
After choosing to edit lease data, a window is presented with the possibility of entering/editing the initial data agreed with the supplier/subcontractors. This data is used for analysis and execution reports.
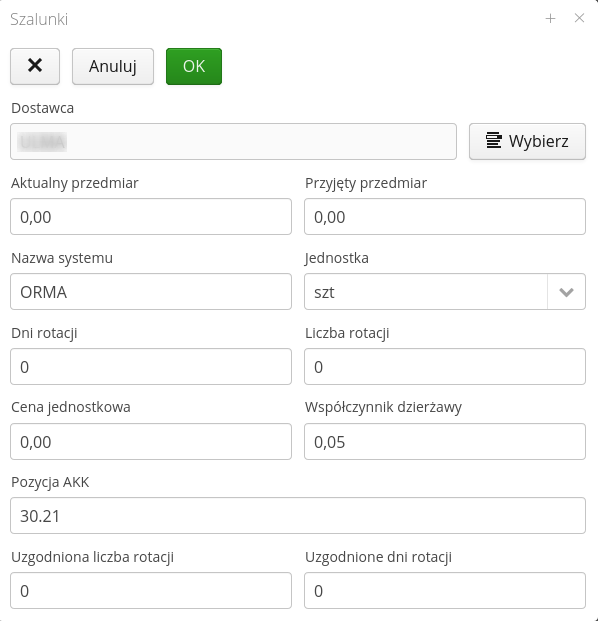
Once these details are approved, all information appears in the basic view of the work order at the bottom of the details view.

The bottom of the job details contains additional information about the lease area associated with the work order. All this information comes from the item (order) we are observing. If a given order has a sub-element (components, construction elements) and they contain partial data regarding the offer/execution, we can summarize the data using the 'Show from sub-orders' button. The system will exclude those elements that cannot be presented in such a case and will sum up the remaining elements in relation to all elements (including a given view).

These data result from saved/imported data (white background fields) and data calculated from other parameters or from various areas of the system (e.g. delivery value)
| When the finance module is enabled, invoice and vendor payment data is available in the work order detail view. |
The view allows you to display invoices, but also a summary, which is available under the Summary button at the bottom of the view.
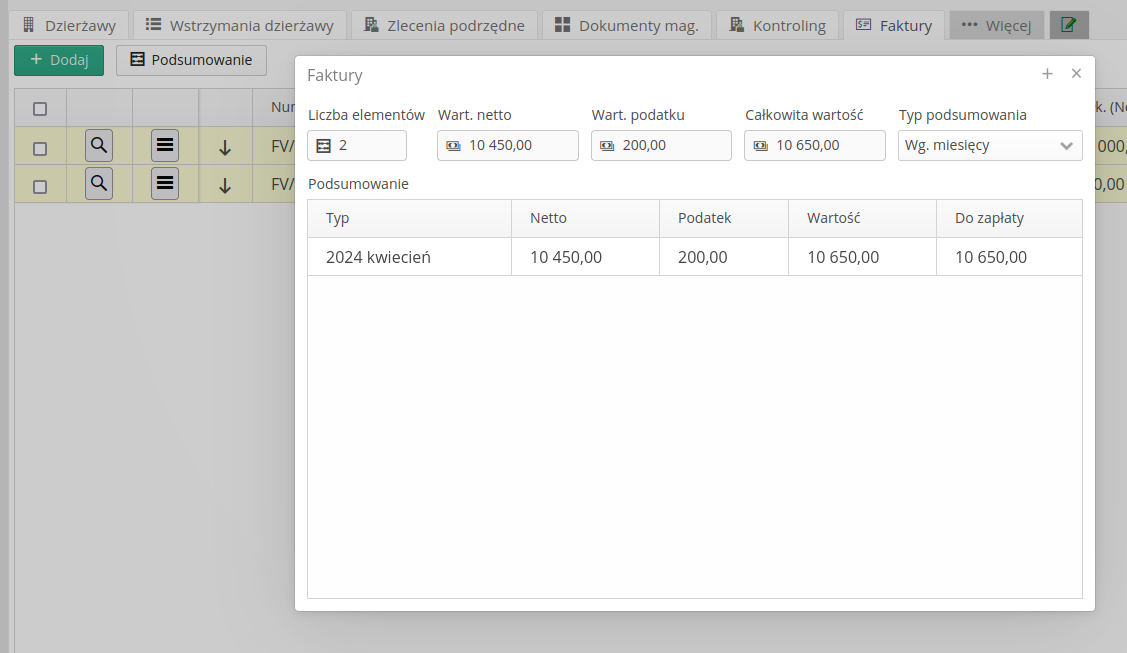
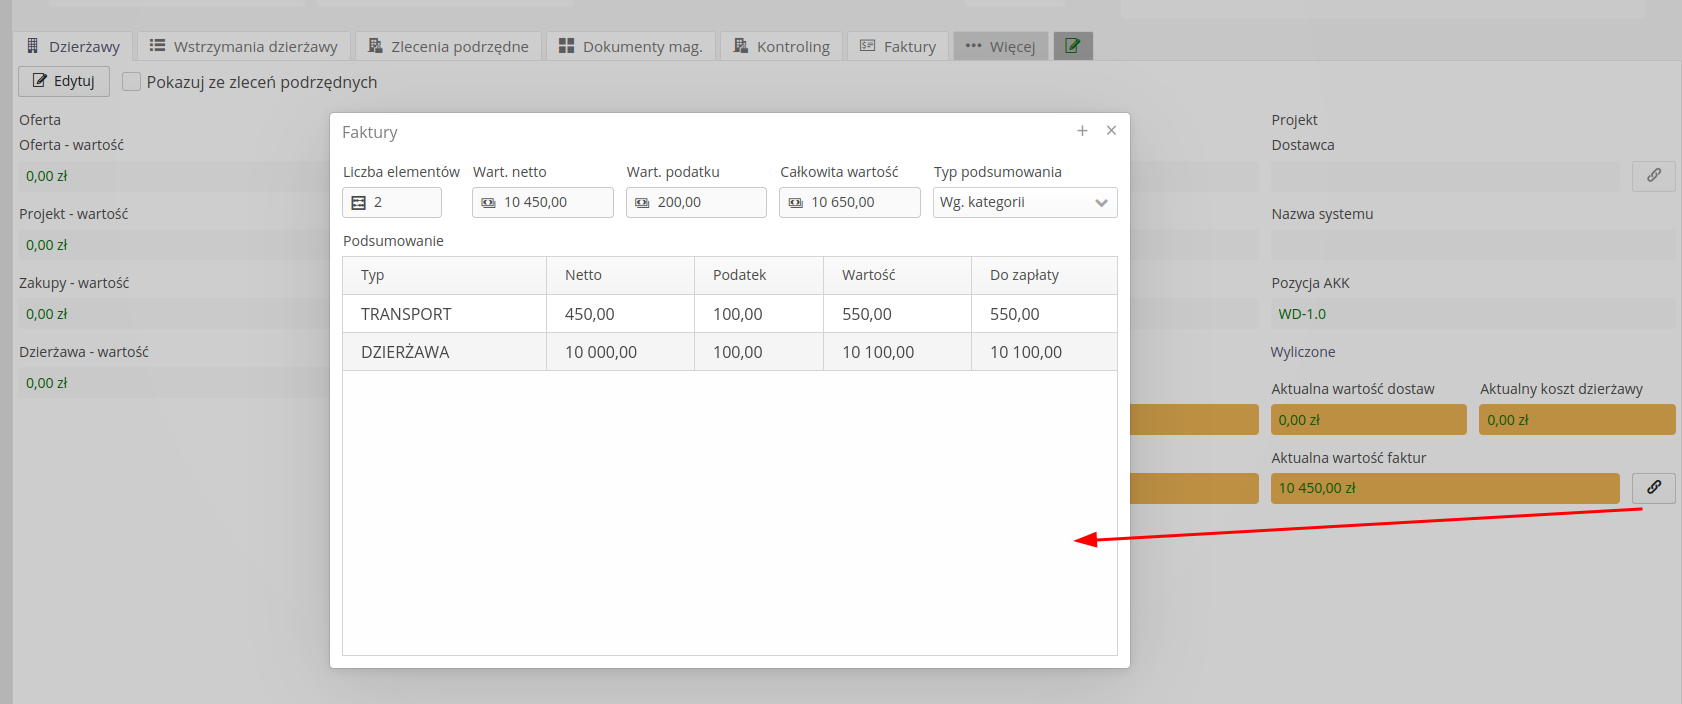
An additional tab includes the definition of order authorizations for contractors (if this function is enabled in the system).

The contractors view allows you to specify access to a selected range of data to people in the user list, and to specify a list of permissions for a given user (which can be done in the mobile interface).
| A very important issue is access to data through the mobile interface. If in the Desktop interface users can see all the information after logging in and can work directly on it, then in the Mobile interface (intended for site work and for subcontractor access) by default no data is presented to the user. It MUST be added to this interface for contractors to be able to see the construction item and related data (orders/supplies) |
| It is possible to define permissions for a user at the contract/contract scope level with intelligent copying to subordinate orders. This allows you to quickly give a group of people permissions to access design elements. |
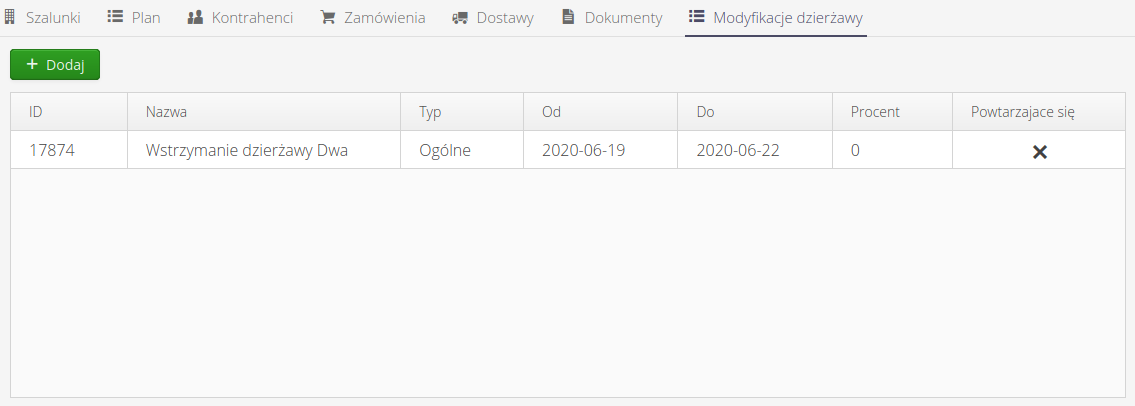
The list of lease withholds presents a list of all lease withholds that have a given design element in the list.
Deleting work orders
Objects cannot be deleted if there is at least one of the order, delivery, warehouse documents associated with the object. These documents must be deleted beforehand so that the object can be deleted.
| When deleting an object, the lease data, account and associated storage location are also deleted. |
Reports specific to lease settlements
Reports available in the context menu of a work order/contract or contract scope allow you to generate basic information about actual costs/settlements with the supplier.
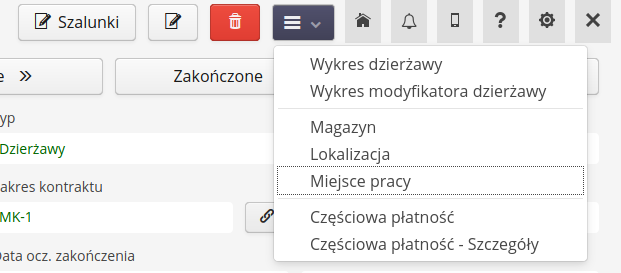
Partial payment report generation allows you to generate summary information on payments to a supplier for a selected construction component.
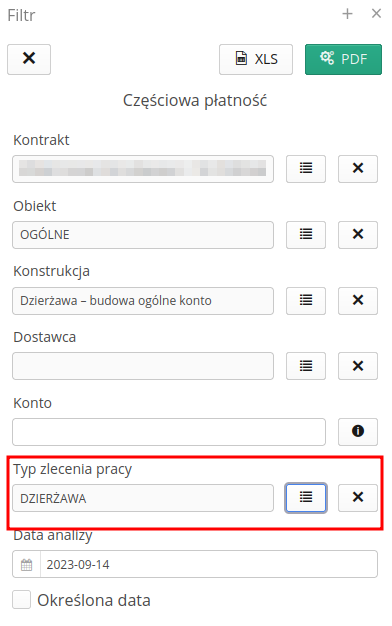
Using the order type, we can limit the view and the list of displayed items.
The filter allows you to specify the range of data to be analyzed and to enter time information for which period reports are generated.
| Please note that for this report, when you do not select a specific date range, but provide information regarding the point in time relative to which you are counting, you MUST have an FRI date defined for the month in the dictionary data. This configuration data can be accessed through the configuration area or through the system menu in the design elements view. |
The Partial Payment Detail report generates detailed rental cost information for individual items included in orders/returns associated with a given work order.
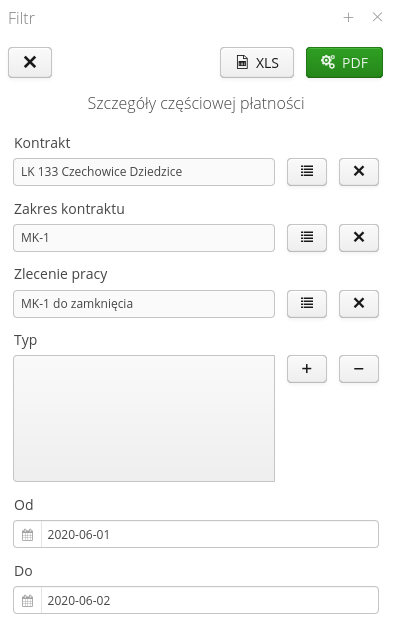
In the filter, in addition to specifying the range of data to be analyzed (structural elements), we can select the range of information generation and the list of element types we are interested in analyzing.
Also here, using the order type, we can limit the view and the list of displayed elements.
| The above reports are also available for grouping elements i.e. contract/contract scope. They will contain the sum of information from subordinate building blocks. |
Reports for Contract/Contract Scope
Analytical reports for the contract/scopes of the contract cover the area of analysis of the progress of the works carried out and comparisons with the data declared in the individual structural elements from the bidding process and arrangements with companies performing work on the leased elements.
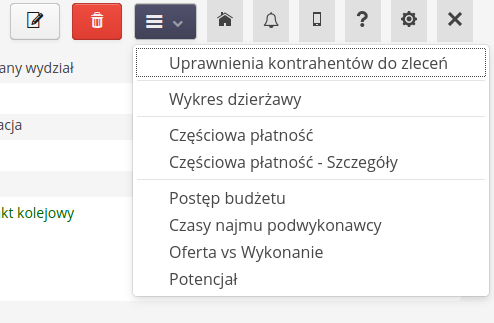
Available reports:
-
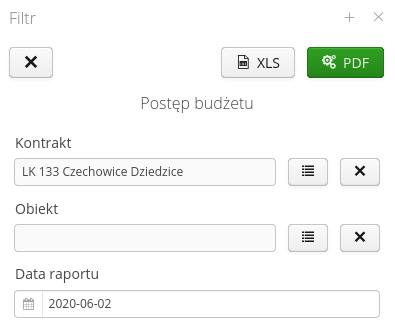
Budget progress - analyzes the progress of budget execution for a given range of data. Compares bid data and data from plans/orders/supplies
-
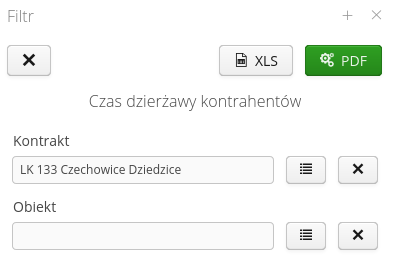
Subcontractor hiring times - analysis of rotation times declared at bidding, rotation arrangements with the subcontractor, and order/delivery costs.
-
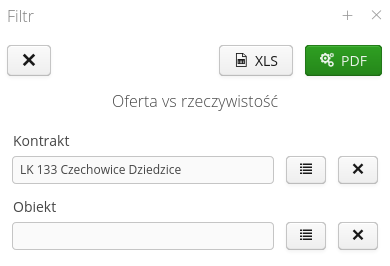
Offer vs. reality - analysis of offer data with data derived from the plans/procurement/delivery process
-
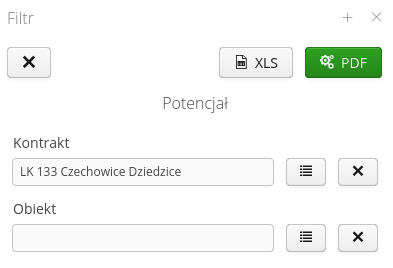
Potential - analysis of the potential of a construction element
Filter view of individual reports:
Lease charts
The charts available in the context menu of a construction element allow you to view details of the actual lease costs of the orders/returns included in a given construction element.
The system allows you to generate two types of charts:
-
basic lease cost chart - costs take into account lease rates for each building block and represent these values over time, taking into account completed deliveries/returns over a given period of time.
| Lease cost charts are based on warehouse documents. This means that only orders/deliveries that will be entered into the warehouse are included in the chart data. Deliveries in transit, returns in loading are not included. |
The chart, once generated, shows on a timeline the lease costs including the lease factor and all delivery/return operations completed in the system.
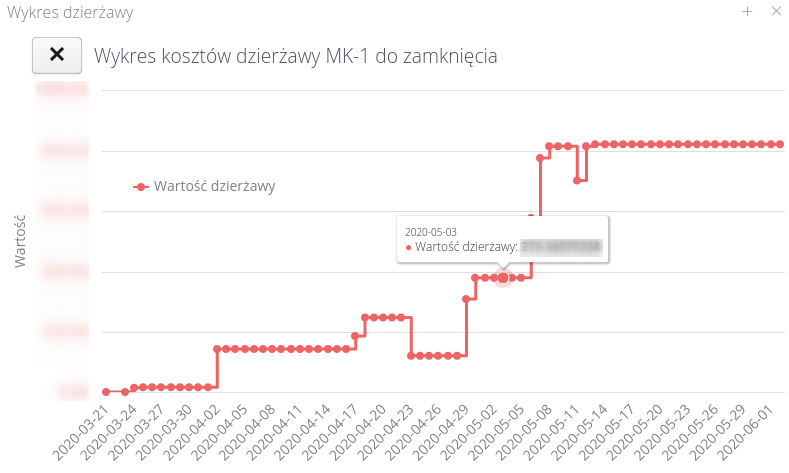
Work orders that have information on the input (offer) parameters in the scope of leases may additionally provide comparative data taking into account the adjustment of lease costs taking into account the values offered.
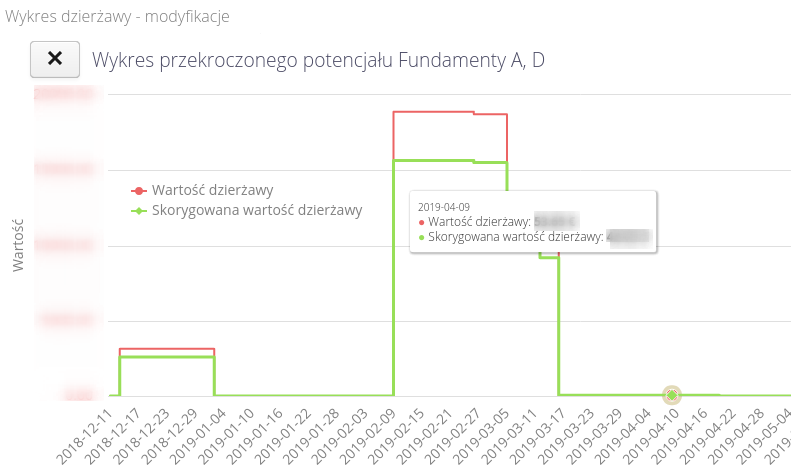
| The graph of lease costs over time is also available in the structure grouping construction elements, i.e. contract and contract scope. In these areas, generation of the chart will result in the appearance of lease cost details for all elements in the group. |
The chart of adjusted lease costs allows you to compare the value of the elements in the stock of a construction element with the declared total value of the construction element by definition.
The chart consists of two values:
-
The value of the warehouse for a given construction item over time. Derived from the value of warehouse documents (receipt/release/movement) over time.
-
The adjusted value is the aforementioned warehouse value adjusted by the correction factor (warehouse value * correction factor) for each point in time.
The correction factor is calculated as the quotient of the total value of leases (potential) for a given structural element and the sum of deliveries for a given structural element. Example:
-
total value of supplies = 0 or total value of supplies is less than the value of leases (potential) for a given structural element → correction factor = 0
-
in other cases, the coefficient is equal to dividing the value of shuttering (potential) by the total value of deliveries
Total value of deliveries - sum of all documents deliveries
The value of shuttering (potential) - the product of the accepted pre-invoice and the unit price of the shuttering (of a given construction element).
Analytics dashboard
The analytics panel view allows access to an overview view of information on all aspects of leases. Access to the analytics panel is available directly from the main menu and from the context menus of the individual analytics-related views, i.e. contract, contract scope and work order/construction element.
The analytical view is divided into three tabs:
-
main one giving background information on the selected scope
-
chart view
-
view of comparison tables
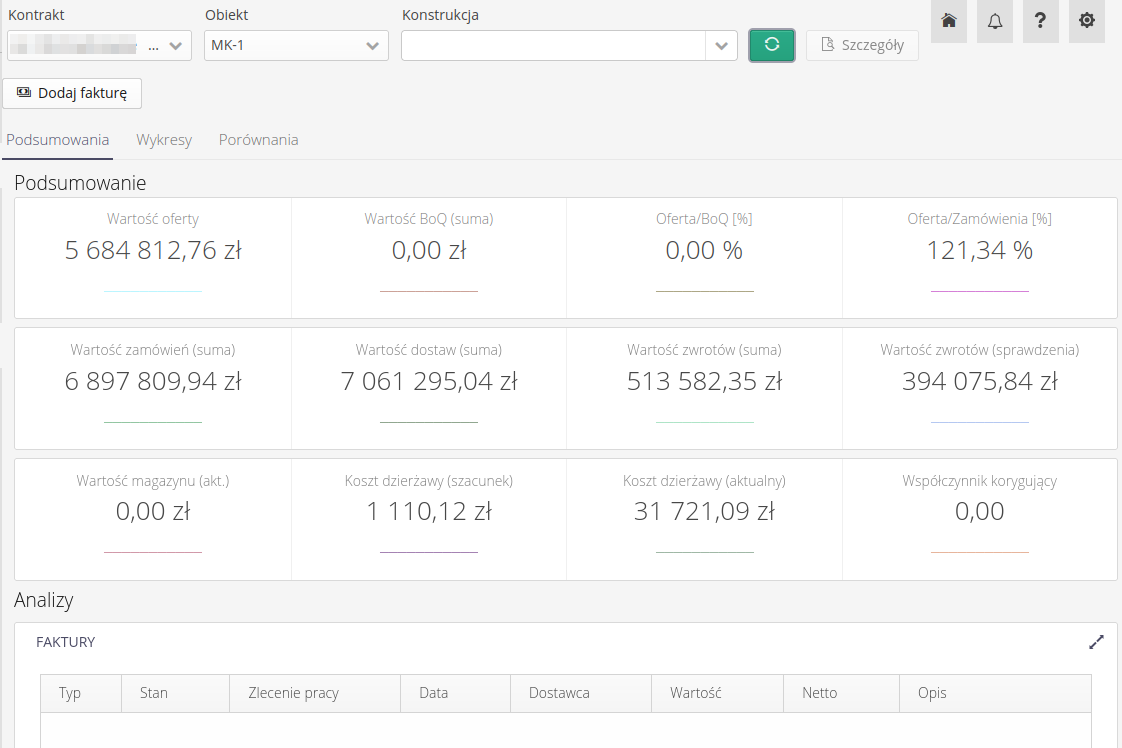
The analysis panel allows you to specify the range of visible data in the Contract → Contract Scope → Construction Element area. We select the range at the top of the view with the ability to nest to an increasingly detailed view. The additional Details button is only active when we have access to the construction details of an object.
The main panel presents information on general financial parameters of leases, bid value, project value and realization and comparative indicators to these parameters. In addition, here are the invoices from the finance module associated with the given scope of analysis.
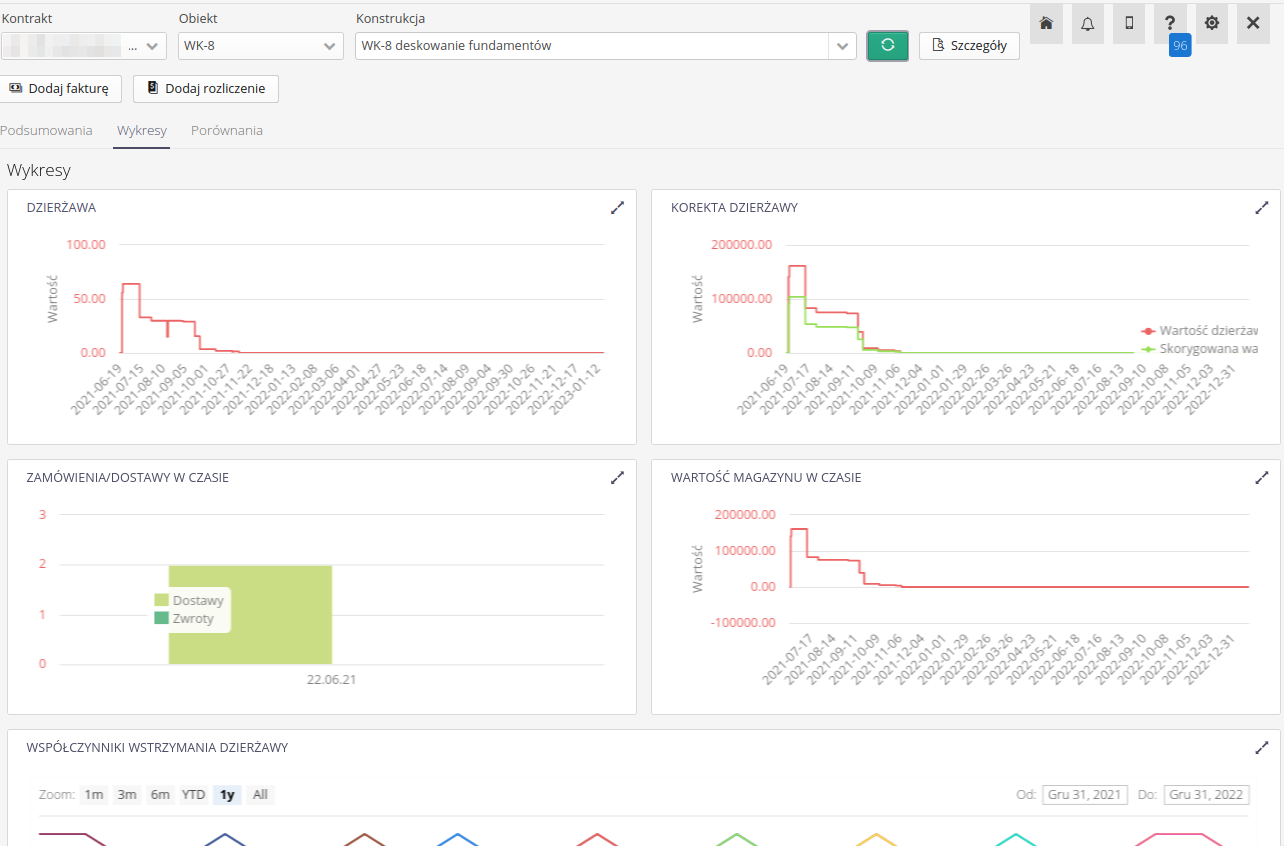
The charts panel shows a set of charts informing about the values of the lease, the warehouse, the number and dates of orders/deliveries/returns, as well as information on active lease adjustment factors (withholdings). All charts can be zoomed to the full screen using dedicated buttons.
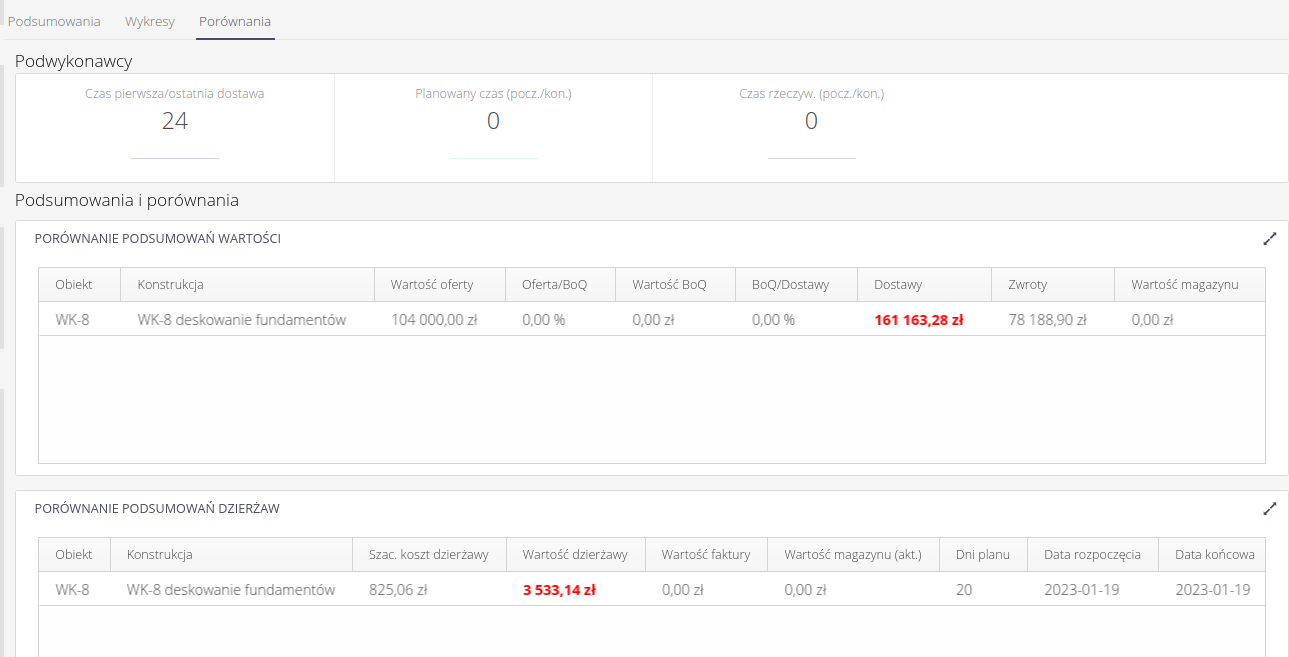
The comparisons panel contains detailed information on the selected scope (for the contract, this will be all construction elements) and presents numerical information on the execution of leases, their turnover times and times per execution and then tabulated views on financial comparisons, lease summaries and performance information on subcontractors executing specific construction elements. All tables can be zoomed to full screen using dedicated buttons.
