Reporting and analysis of production data
Reporting and analysis of production data
Analysis and reporting of production data in the field of energy production allow monitoring of freely definable parameters of plant operation and monitoring of their reporting. Based on the entered data, it is possible to generate data necessary for external reporting to institutions responsible for monitoring e.g. environmental parameters.
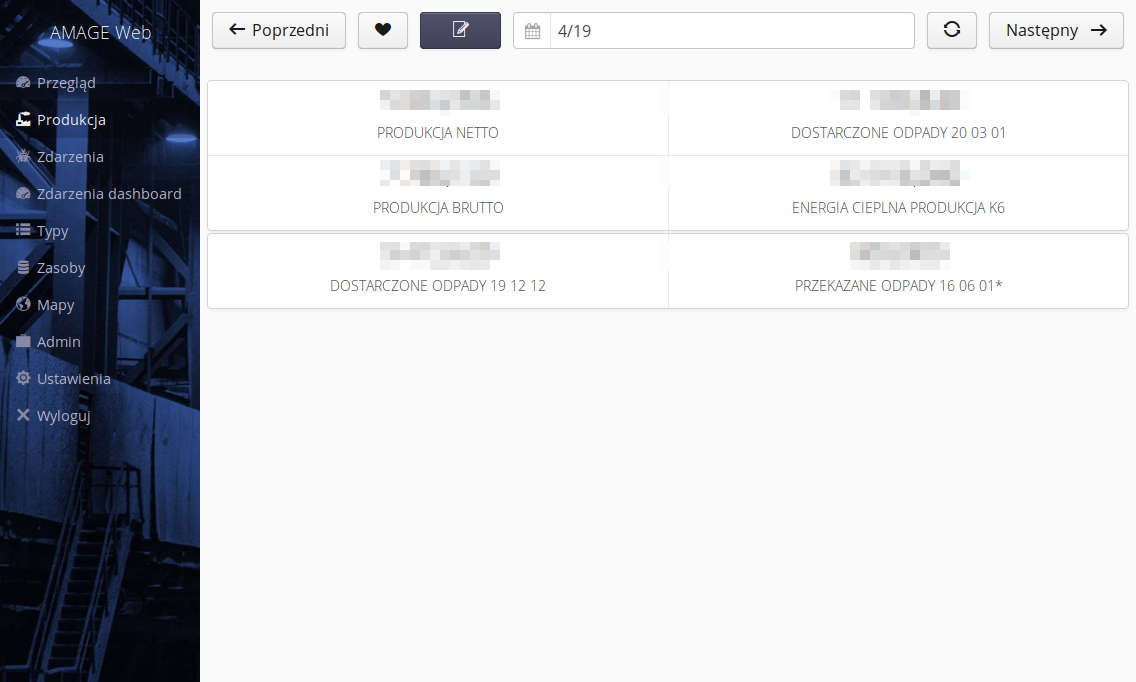
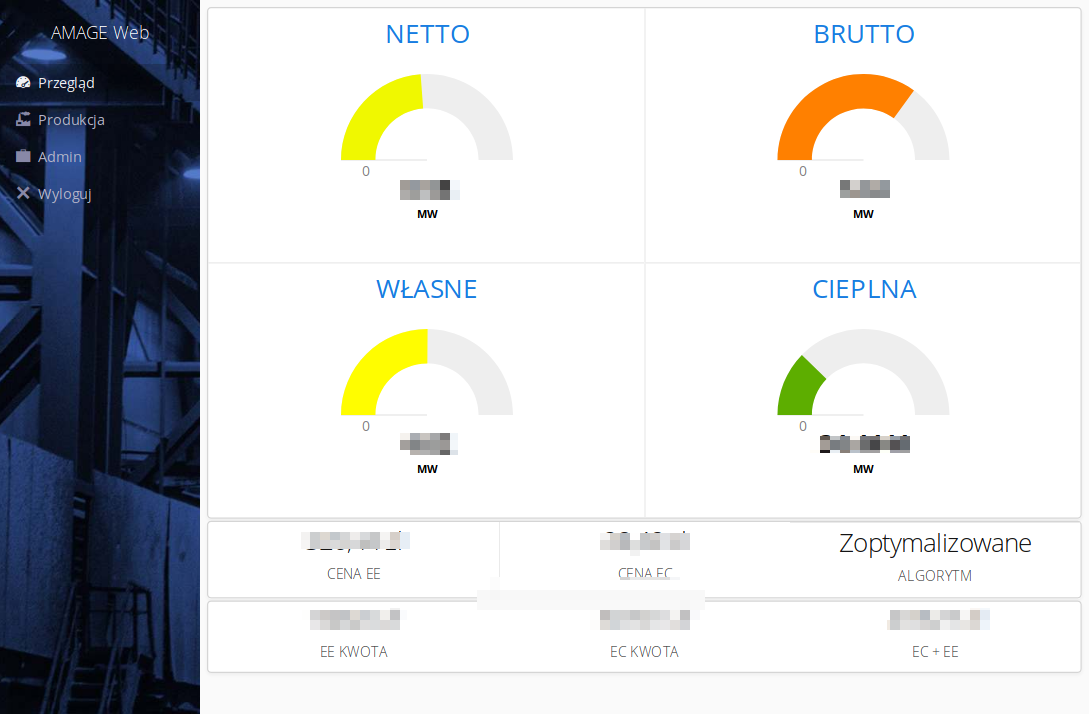
The start screen is a general view of the production data of interest. A visualization dashboard is available in the menu under the 'Production' link. Depending on the system configuration, information about key parameters appears on it.

There are buttons on the top bar: * To navigate between months. By default, the current month is loaded. * to choose a month from the calendar * view refresh * Move to the detailed monthly view. The button takes you to the details of a particular month.
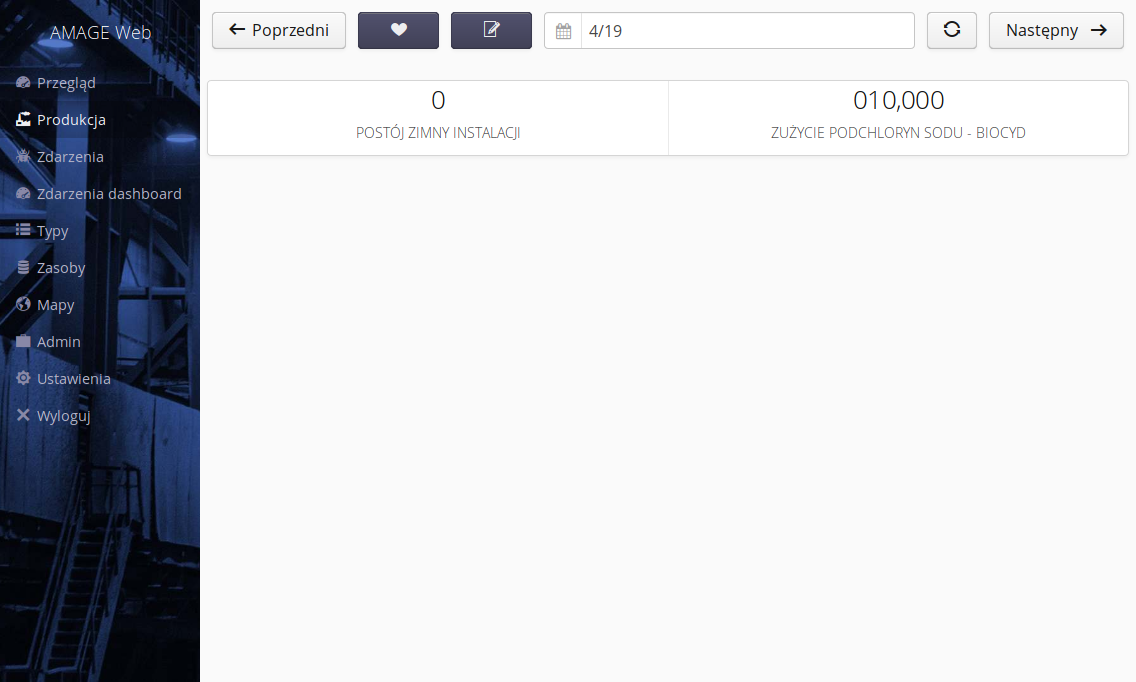
The default view is the view of the current month. Use the navigation buttons to move forward or backward to the selected/other month. Selecting a button with a heart icon allows you to view your own parameters specified as favorites.

| Views of the rest of the system for reporting and analyzing production data can be found in the documentation of the desktop version. |
