Service events
Service events
The service events module allows you to create, manage and edit service events created during the performance of activities in the plant or on the construction site.
| Service events in the AMAGE system are always associated with a specific resource, i.e. the event concerns a specific device, component, element. If there is a need to report general comments, the mechanism of service notes is used for this, which are not related to a specific resource. |
The system provides a summary and analytical view of the service work performed. It is available under the main link 'Dashboard events'. After selecting it, the analytical view of service events is presented.
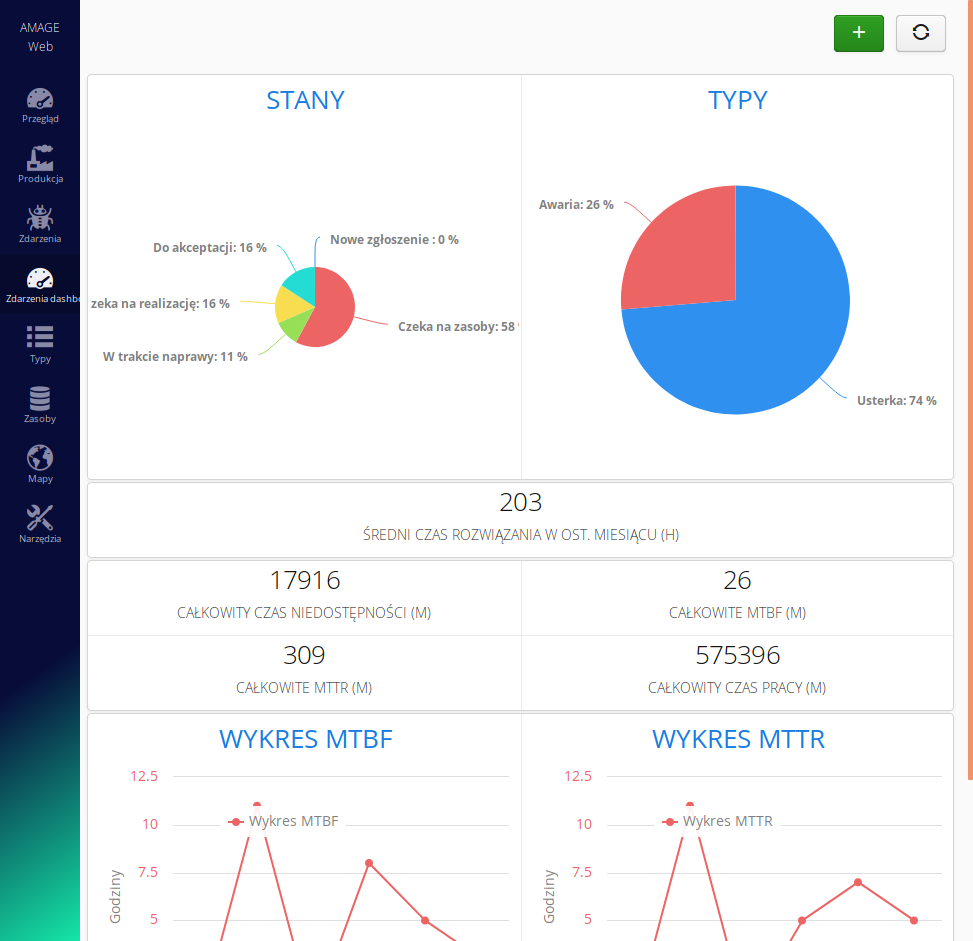
In the view, pie charts present information about the breakdown of active service events by statuses and types. Below you can find statistical information on service events such as unavailability times, repair times, etc. Below you can see graphs related to the monthly analysis of MTBF and MTTR parameters for all reported devices.
| The charts include only states that mean the active state of events, i.e. those that still require team action. |
Event list
After selecting the 'Events' action from the main menu, the user is presented with a list of service events that are assigned to him. This allows us to quickly check and act on events for which we are responsible.
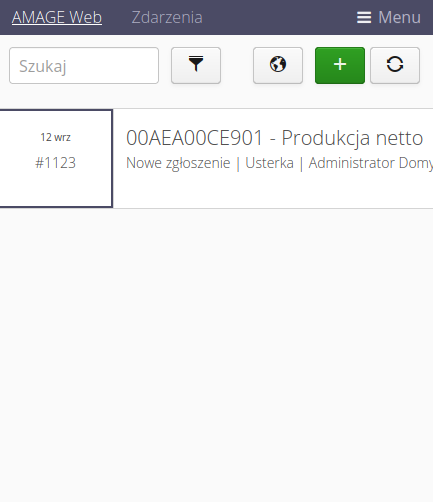
Filters allow you to quickly find a filter. We can use the general search box that searches through comments and resource names, or select the filter button and display a detailed filter.
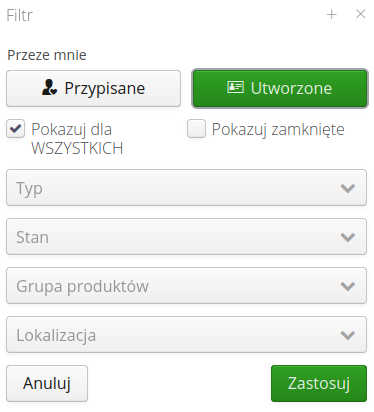
When you open the filters, additional controls appear that allow you to filter service events as expected.
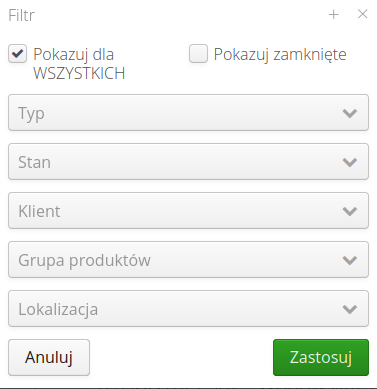
Filters available:
-
By Me - Created, Assigned - shows tickets that I created or am assigned to
-
For everyone - shows all tickets, not just those assigned to me
-
Closed - also shows closed tickets
-
State, Type - a filter that selects the appropriate status and type of service events to be displayed
-
Client - client selection if we work in multi-client mode
-
Location - selection of location
-
Product group - selection of resources from the product group
Selecting the 'For all' option displays all active reports.
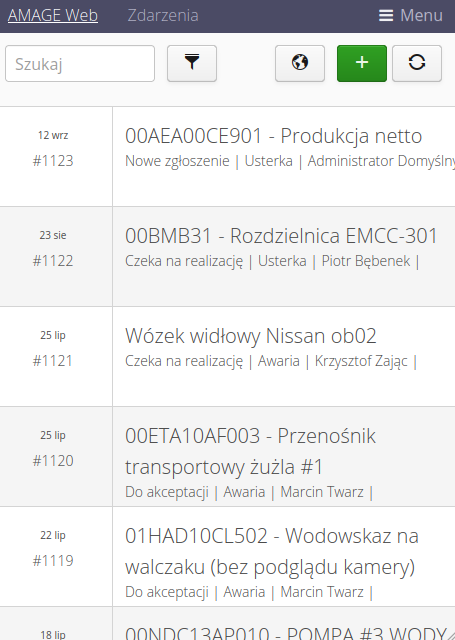
After selecting any event, we are redirected to the details page of a given service event.
Map view
The service module has an integrated map view. We can go to it via the globe button in the main view.

The view shows a map (or plant plan) with service events marked on it in their geolocation.
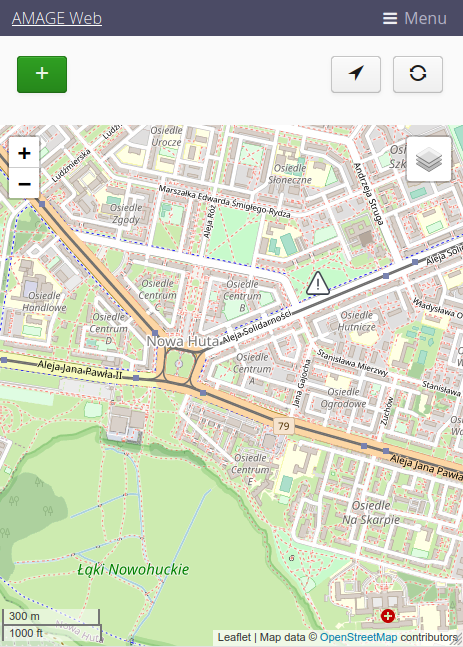
| To learn how to import your own plans/maps to the system, refer to the system configuration and tutorials on mechanisms for preparing plans/maps from DWG drawings. |
To add a new event on the map, select the (+) button and then select a point on the map. After selecting this point, the event registration window opens with the geolocation already filled in.
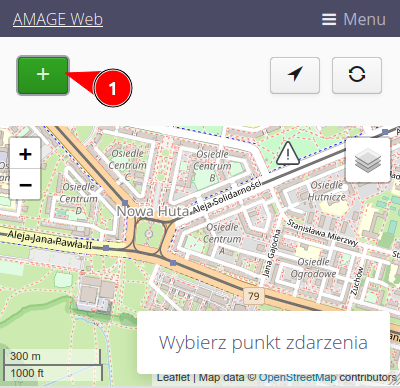
Further adding the event as usual, as in the case described earlier.
Event details
The service event detail view shows information about a given service event. The common information includes information about the related resource affected by the event, description, type, number (unique identifier), creation dates, assigned person and a list of comments that were created during the event handling.
The main actions allow you to add a new comment and add a new service (explained later). Shortcuts allow you to display a list of services added to a given event and a list of photos/photo notes created for a given event.
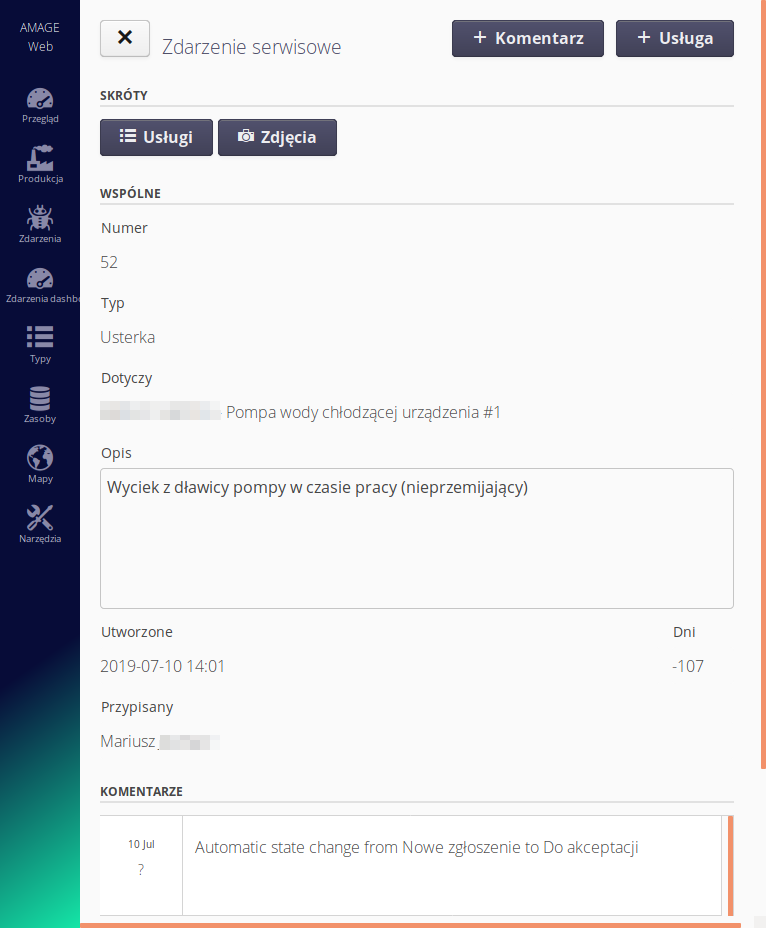
If the ticket currently being viewed has the option of changing its status to another, the system additionally displays quick actions to be performed. All allowed state changes appear in the list. Selecting any state will AUTOMATIC select that state and save the user who made the change.
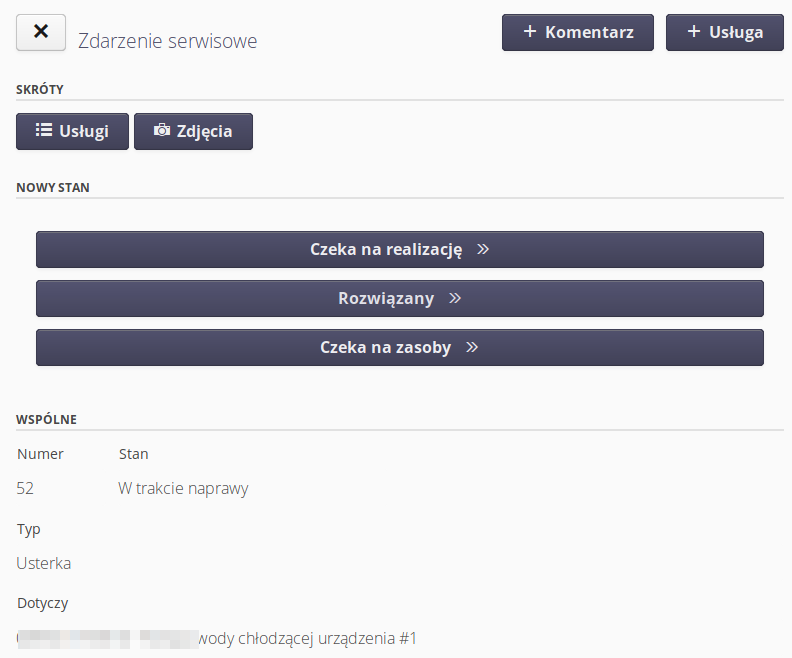
| This functionality allows you to quickly report the progress of work on a given request, especially with the use of a mobile interface available from devices such as a phone/tablet. |
Selecting the '(+) Comment' action allows you to add a comment to the event.
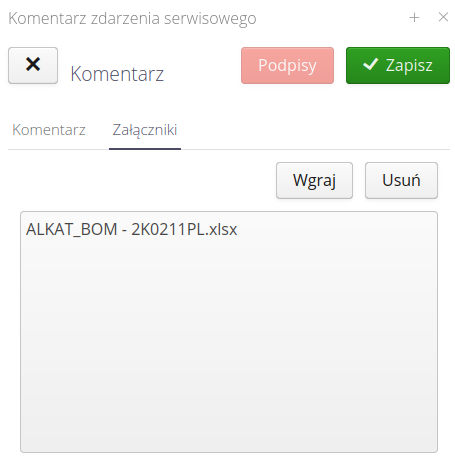
In an action, it is possible to describe the actions we perform, but also to change the assignment of the event to another person and to change the state in which the event is located. If the state requires saving an electronic signature, the Signatures button will be active. The 'Attachments' tab allows you to send attachments. They will be included in the list of all service event attachments and the comment will be extended with information about adding files.
| Depending on the configuration, the system can send information to people associated with the event, e.g. via email, on each change of the event. |
Creation of a new event
Choosing to create a new event opens a window where you select the device (resource) to which the event applies, the type of event, the description, and select the person assigned to the event.
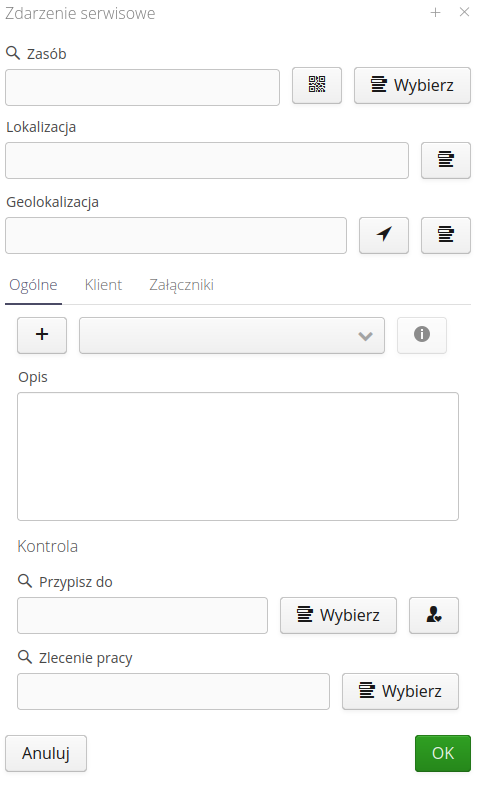
The window allows you to specify additional elements such as location, geolocation, type, status, description, assignment to the order, etc.
The list of resources allows you to filter resources and select the appropriate device, to assign an event to it.
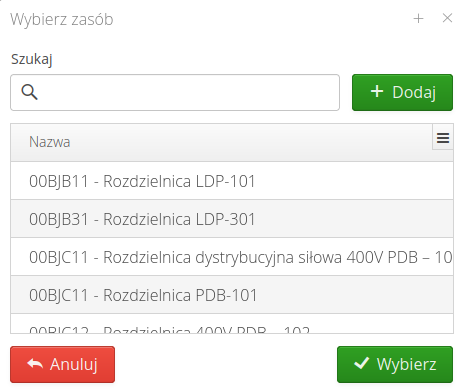
In the 'Attachments' tab you can add photos or other related files to the report. The 'Client' tab, active only in the multi-client version, allows you to enter identification data and service information.
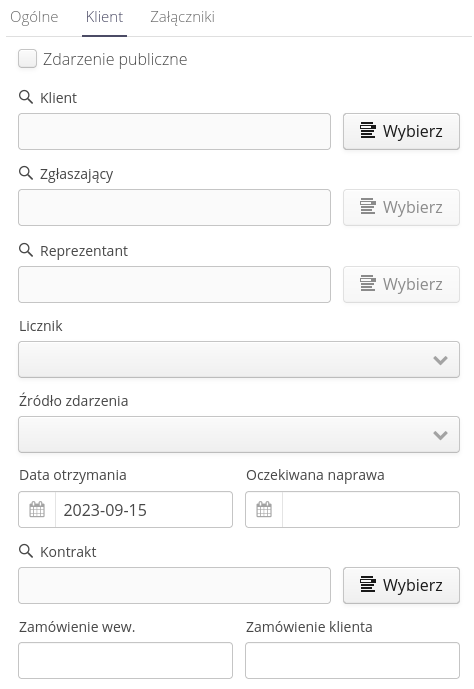
| If a device cannot be found, there is an option to create an event without the selected device, or you can switch to the view of creating a new resource and supplement the database with additional information. |
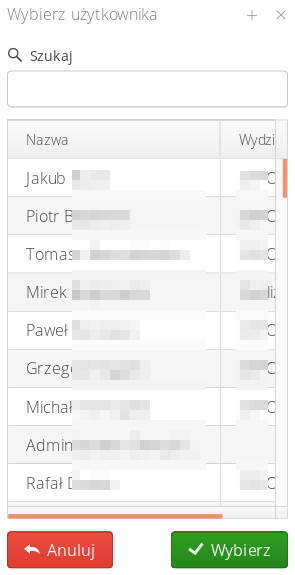
After selecting the list of users, a window appears where you select the person to whom the event will be assigned. He or she will be notified that the event has been created (with the appropriate event configuration in the extended application).
Services
The services mechanism is used to enter additional information about the external costs of an event. The service categories are definable and can be, for example, external invoices, warehouse documents or hours worked on an event. We define the types of service categories in the extended application. In this view, we select only the type of service and enter information about costs, etc.
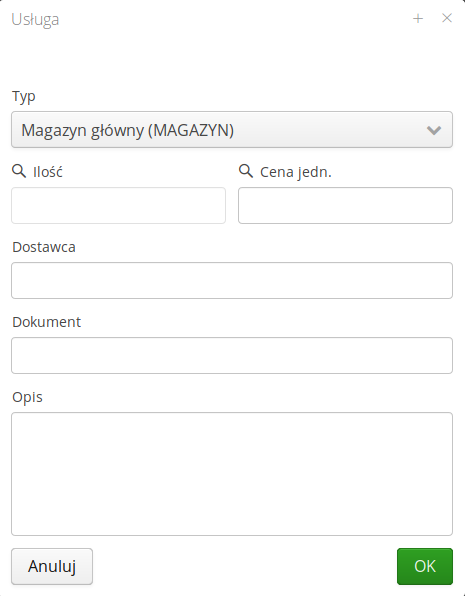
Once a service is entered, information about it is available in the list of services from the event.
| It is possible to integrate the services mechanism with external accounting/warehouse systems. In such cases, after integration, it is enough to mark the cost on the invoice or warehouse document with an event number, e.g. #123, and the AMAGE system will automatically retrieve the cost from the external system and include it in the services. |
Service events
The service events module allows you to create, manage and edit service events created during the performance of activities in the plant or on the construction site.
| Service events in the AMAGE system are always associated with a specific resource, i.e. the event concerns a specific device, component, element. If there is a need to report general comments, the mechanism of service notes is used for this, which are not related to a specific resource. |
The system provides a summary and analytical view of the service work performed. It is available under the main link 'Dashboard events'. After selecting it, the analytical view of service events is presented.
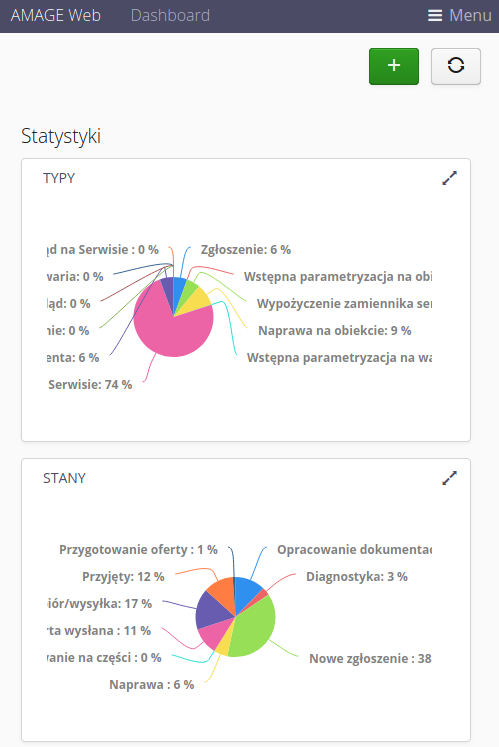
In the view, pie charts present information about the breakdown of active service events by statuses and types. Below you can find statistical information on service events such as unavailability times, repair times, etc. Below you can see graphs related to the monthly analysis of MTBF and MTTR parameters for all reported devices.
| The charts include only states that mean the active state of events, i.e. those that still require team action. |
Event list
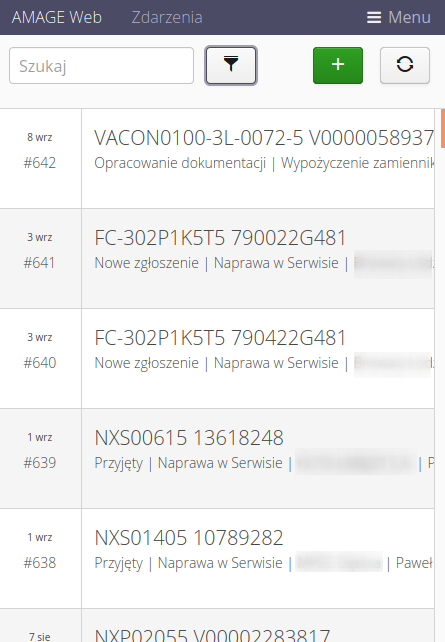
After selecting the 'Events' action from the main menu, the user is presented with a list of service events that are assigned to him. This allows us to quickly check and act on events for which we are responsible.
When you open the filters, additional controls appear that allow you to filter service events as expected.
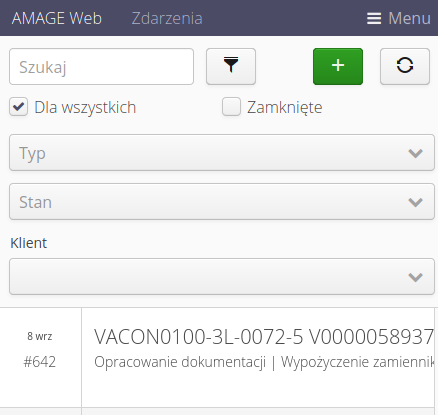
Filters available:
-
For everyone - shows all tickets, not just those assigned to me
-
Closed - also shows closed tickets
-
State, Type - a filter that selects the appropriate status and type of service events to be displayed
After selecting any event, we are redirected to the details page of a given service event.
Event details
The service event detail view shows information about a given service event. The common information includes information about the related resource affected by the event, description, type, number (unique identifier), creation dates, assigned person and a list of comments that were created during the event handling.
The main actions allow you to add a new comment and add a new service (explained later). Shortcuts allow you to display a list of services added to a given event and a list of photos/photo notes created for a given event.
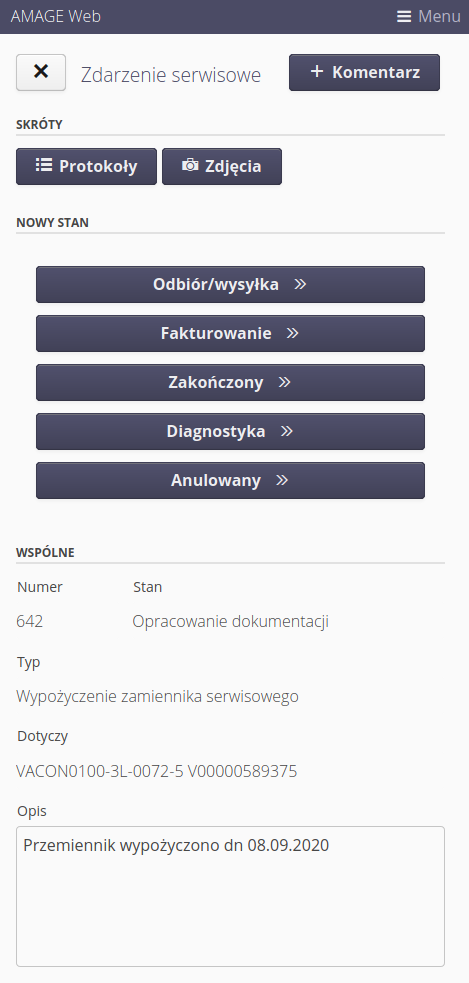
If the ticket currently being viewed has the option of changing its status to another, the system additionally displays quick actions to be performed. All allowed state changes appear in the list. Selecting any state will AUTOMATIC select that state and save the user who made the change.
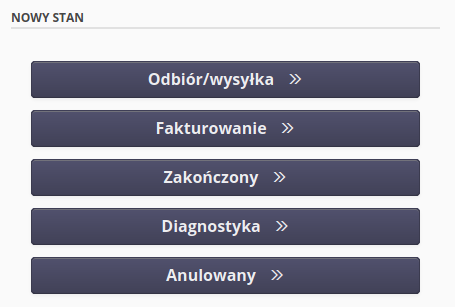
| This functionality allows you to quickly report the progress of work on a given request, especially with the use of a mobile interface available from devices such as a phone/tablet. |
Selecting the '(+) Comment' action allows you to add a comment to the event.
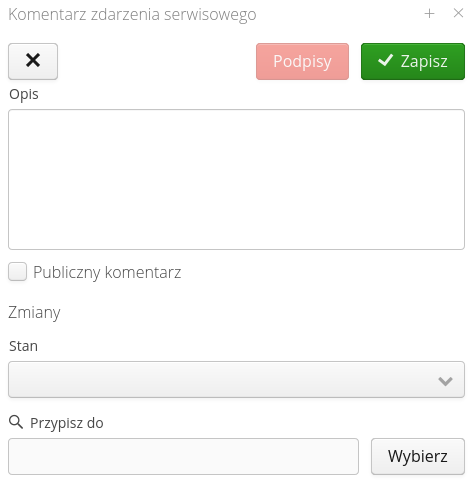
action, it is possible to describe the actions we perform, but also to change the assignment of the event to another person and change the state in which the event is located.
| Depending on the configuration, the system can send information to people associated with the event, e.g. via email, on each change of the event. |
Creation of a new event
Choosing to create a new event opens a window where you select the device (resource) to which the event applies, the type of event, the description, and select the person assigned to the event.
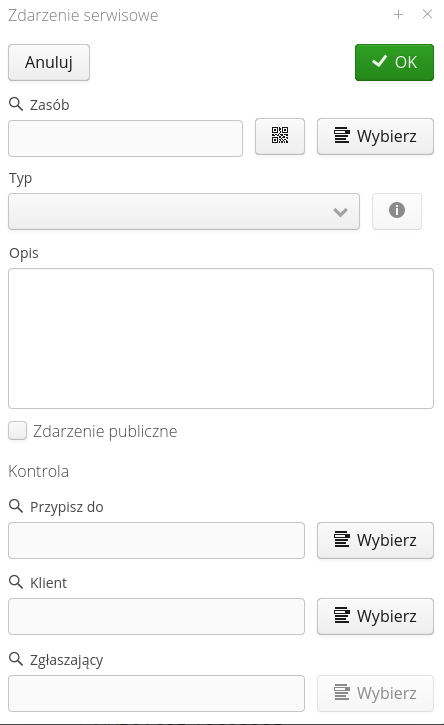
The list of resources allows you to filter resources and select the appropriate device, to assign an event to it.
| If a device cannot be found, there is an option to create an event without the selected device, or you can switch to the view of creating a new resource and supplement the database with additional information. |
After selecting the list of users, a window appears where you select the person to whom the event will be assigned. He or she will be notified that the event has been created (with the appropriate event configuration in the extended application).
Service protocols
Access to service protocols in the mobile view is possible through the main menu Protocols.

By default, after entering the list of protocols, only protocols assigned to the currently logged in user are displayed, which are not closed.
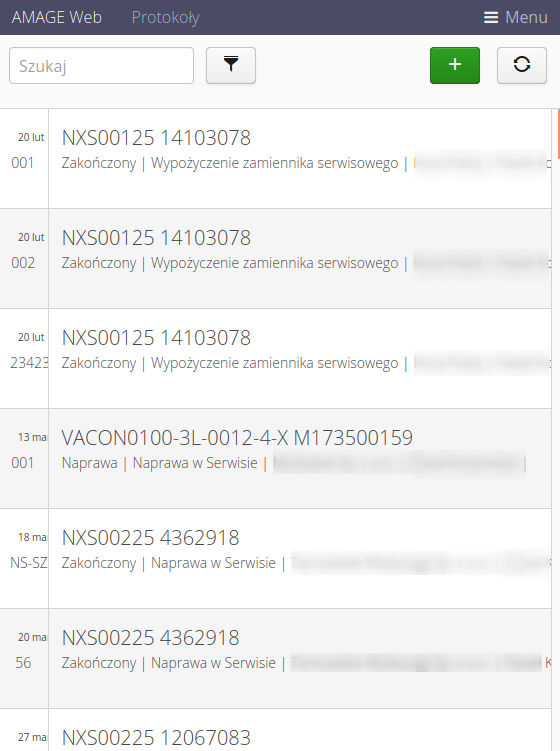
After selecting the filter button, additional options appear that allow you to additionally limit/extend the presented data. Selecting Show Closed will display the protocols assigned to the user that already have the complete flag. Selecting For all will display the logs for all users on the system. Selecting a counterparty will limit the protocols to the selected counterparty only.
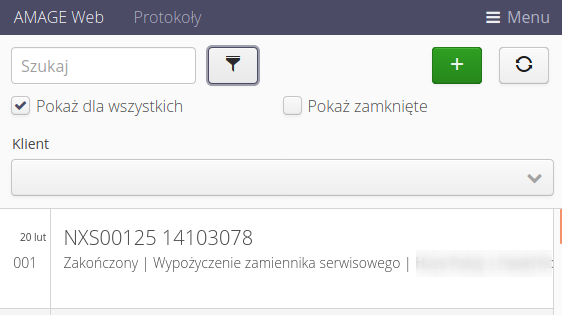
After selecting any protocol, the execution details of that protocol are displayed. They contain all information entered during execution of this protocol.
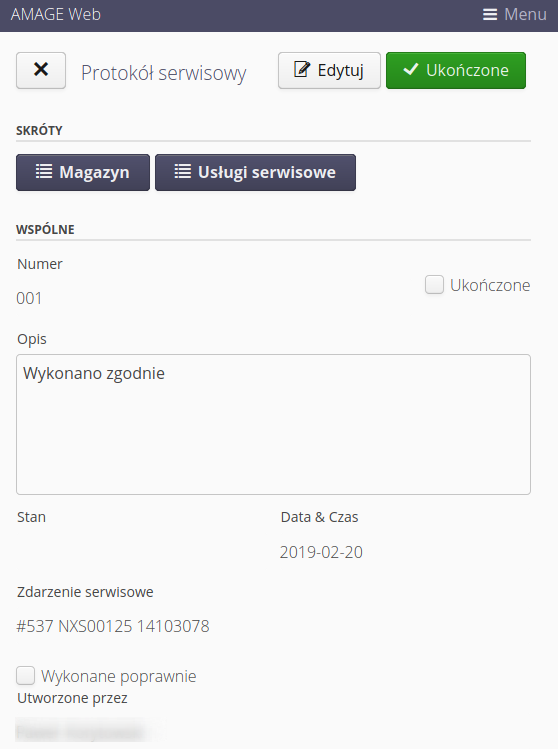
In the case of not closed protocols, we have the option to Edit the protocol or mark the protocol as completed Completed. After confirming completion, the protocol is finalized and the available functions in the protocol change.

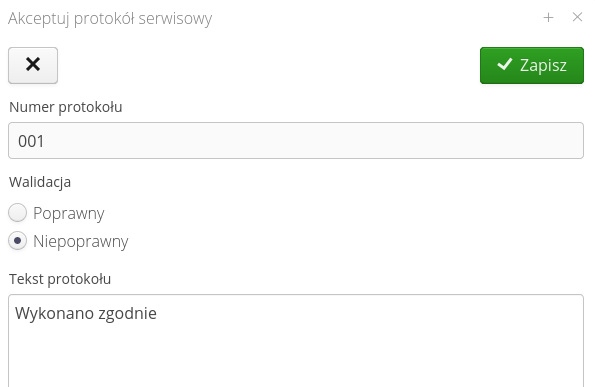
After approval of the protocol, the functions Check become active, which calls the window for checking/accepting the protocol, and Report, which allows you to generate a report from the protocol

In the service log details view, you can follow the log check procedure by the person coordinating such work. Calling it displays a window with the possibility of entering data and marking the status of the protocol execution.
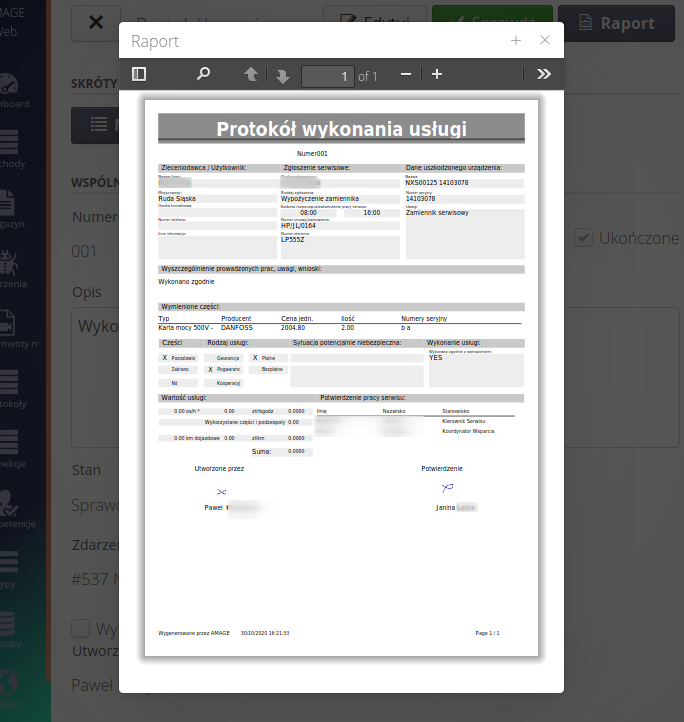
The protocol can be generated as a PDF report. All data entered into the protocol appears in the report. The report can be saved locally or sent by email.
Protocol execution
Adding/editing a service protocol allows you to enter all the necessary information about the protocol. The data is divided into sections: Common, Cost, Other, Warehouse & Services.
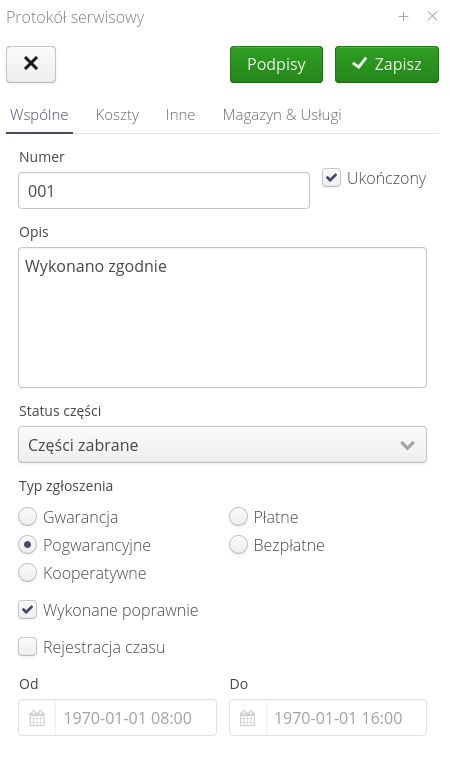
Available options in the common view:
-
Number - protocol number
-
Complete - whether the protocol is completed and ready for inspection
-
Description - description of the protocol activities.
-
Part status - status of the part during repair (left, taken).
-
Filing type - cost and performance filing type.
-
Performed correctly - whether performed correctly and no further intervention is required.
-
Time recording - recorded repair time.
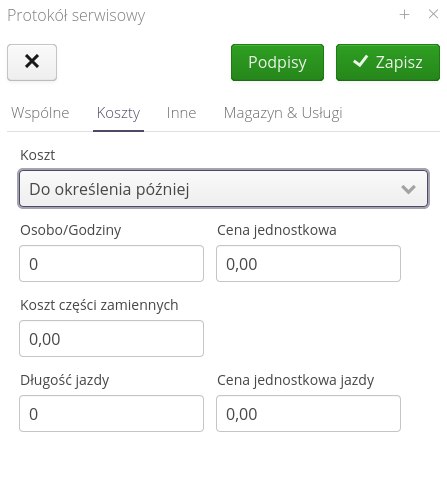
Available fields in the cost view:
-
Cost calculation type - cost calculation type (given directly, calculated).
-
Person-hours + unit price - number of man-hours + unit price.
-
Cost of spare parts - cost of spare parts.
-
Length of ride + price per km - length of ride and rate per km.
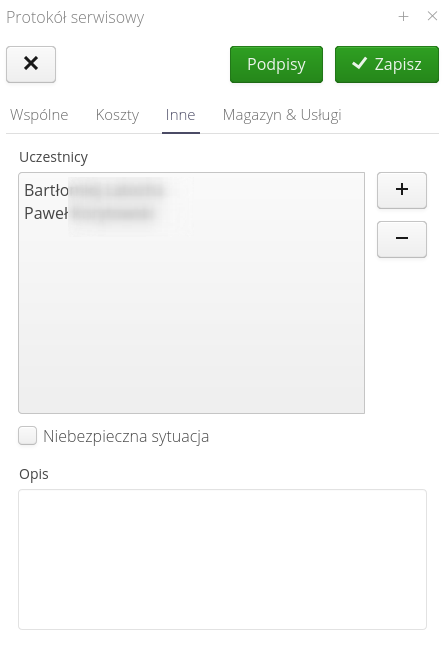
Available fields in the Other view:
-
Participants - a list of participants in activities related to this protocol. They will be included on the report
-
Dangerous situation + description - whether a dangerous situation occurred during the repair work and a description of this situation.
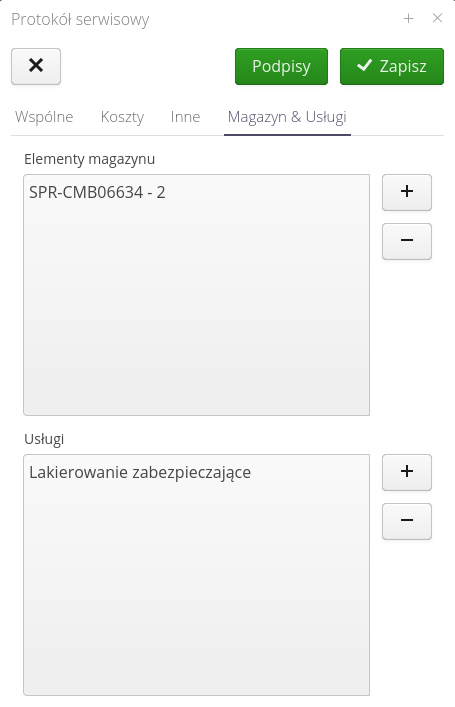
Available fields in the Warehouse & Services view:
-
Elements taken from stock - list of elements taken from stock
-
Services added to protocol - a list of services plugged into a given protocol.
If signatures are indicated to be required for the protocol, the Signatures button will be red until the signatures of the contractor and/or contractor are not affixed to the protocol.