Inspections
Inspections
The inspections module allows you to access the list of inspection executions and enables you to execute them through an accessible interface.
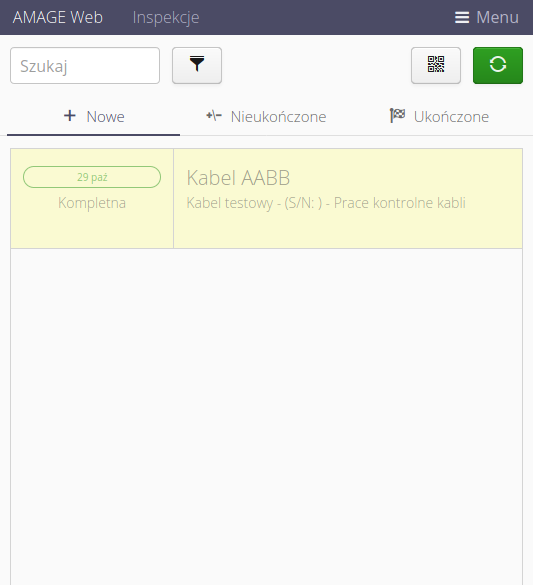
By default, when you enter the list of inspection executions (via the Inspections menu), only the inspections assigned to the currently logged-in user are displayed. These are divided into three groups:
-
New - new inspections that have not yet been performed/opened
-
Uncompleted - inspections started that do not have a completion flag.
-
Complete - inspections with completion flag marked.
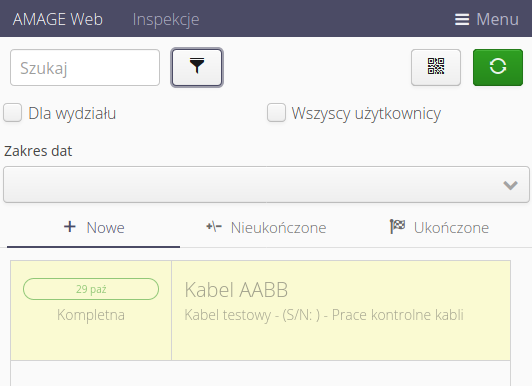
When you select the filter button, additional options appear that allow you to further limit/expand the data presented. Selecting For Department will display all inspection executions assigned to employees of the department to which I myself am assigned. Selecting All Users will display inspections for all users in the system. Selecting a date range will limit inspections to those scheduled to be performed in a given time period, such as today.
Quick access to inspections of a selected resource is possible by scanning the code/ID assigned to the resource. When you select the scan button (or automatically enable the background scanner from the AMAGE Shell application), the system will filter out only those inspections that apply to the particular device whose code you have scanned.
Selecting any inspection execution proceeds to the actual execution of that inspection.
Adding an inspection
In the mobile view, it is possible to add a virtual inspection. To enable this, you must enable this option in the configuration flags.

When this flag is enabled, an additional (+) button will appear after switching to the mobile view, which will allow you to add an inspection directly from this view. The addition is identical to the desktop application.

| Note that you can add audit execution for a specific resource directly from the resource view. In the bulk view, we only add virtual inspections (bulk). |
Executing inspections
Performing an Inspection loads all the information needed to perform an inspection and presents it in tabbed form. The interface is adapted to work on mobile devices and adapts to the available space.
| The system automatically saves the current inspection status every 30 seconds. This allows data to be restored in the event of a network outage, for example. |
Depending on whether an inspection has defined questions/measurements/tasks then the corresponding sections of the inspection execution are visible or not.
The question list presents each question in a separate section. The sections are colored alternately so that it is clear to which question all the controls belong. The question displays its content. Under the (i) button, an additional description of the question is available. Depending on whether the question is a YES/NO or an enumeration type, the system presents a set of buttons or a checkbox. When a question is completed, the icon changes from gray to green. Questions marked with an asterisk (*) are mandatory questions to answer.
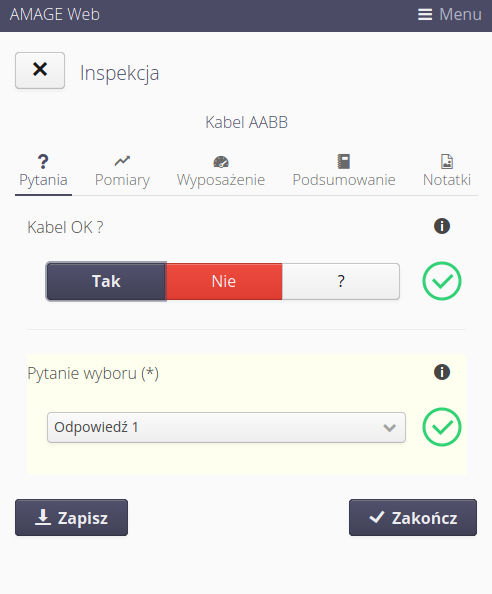
For questions with a text answer, additional text fields appear with the opportunity to enter the answer and save additional information.


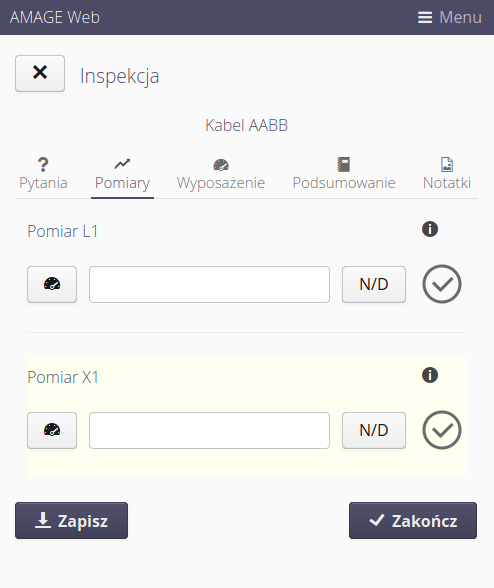
The measurements section contains all measurements defined in the inspection. The list indicates the correctness of the measurement taken by changing the icon to green. If an error (e.g., exceeding the range) occurs during the measurement validation, the icon is changed to a yellow warning triangle. For each measurement, you can use the measurement icon to select the measurement device with which the measurement was performed. Marking a measurement as N/D means, an indication that the measurement was unavailable for execution.
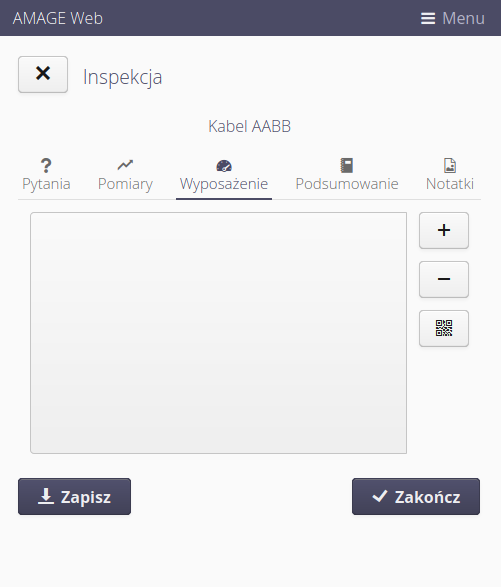
For measurements/whole inspections, it is possible to indicate the measurement equipment that was used during the measurement. This is realized in the Equipment section. To it, you can add in a list of devices that will be available in the inspection report and available for indication at the measurement, with which measurement device this measurement was made. In addition, you can add a device by scanning a code, if the device has such an identifier.
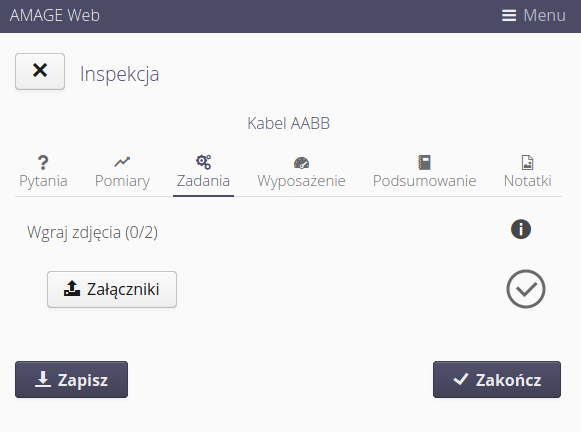
The task list contains information on the necessary tasks to complete a given inspection. According to the definitions, a task can be scanning the RFID code of a device, taking pictures or attaching files. Completion of a task is indicated by a green icon.
The summary section allows you to record textual information about the completion of the inspection, mark the status of the inspection, e.g., whether the device requires additional attention/repair, and record executor/contractor signatures. If a signature is required the corresponding button lights up in red. In addition, the date of the next inspection of this type can be specified here.
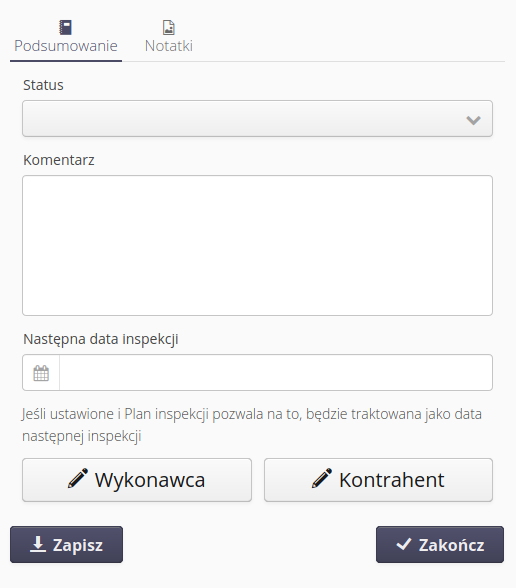
| The date of the next inspection is used by the inspection planner only when the option to use this information is selected in the inspection plan. |
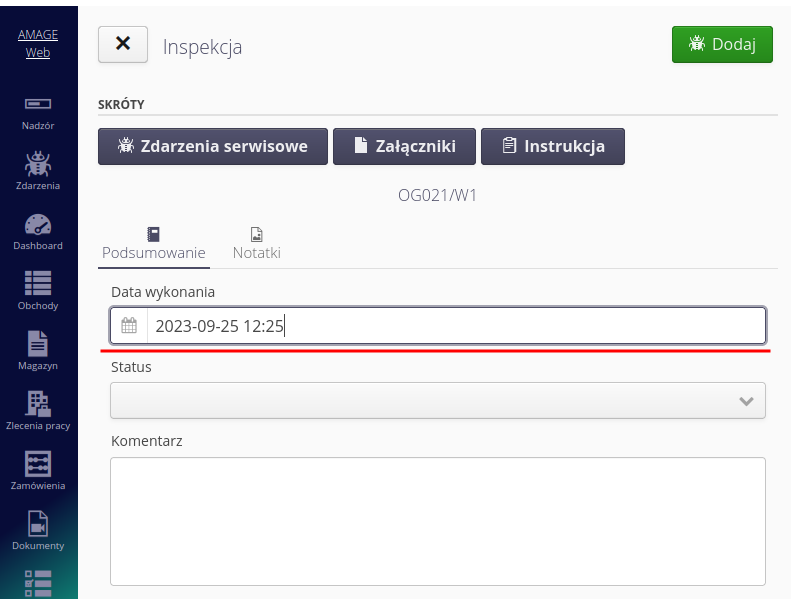
If the option about changing the date of the inspection is checked in the inspection template, there will be an additional space in the summary for entering the actual execution of the inspection.
In addition, it is possible to add photos and other files to the inspection. This can be done in the Notes section where we include photos taken directly by the device or available in the device’s file system.
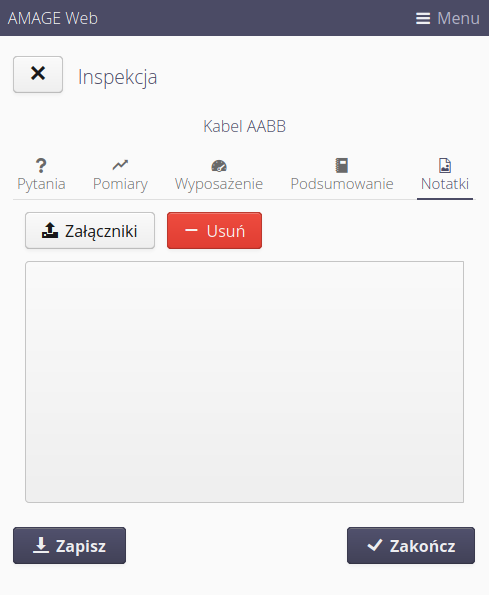
The inspection execution system can be terminated by either Saving the data. In this case, the inspection is only saved in the database and you can return to it at any time. Selecting the Exit option verifies that the inspection has been performed correctly (that all steps have been performed) and marks the inspection as having been performed correctly. Which causes this inspection to proceed to the next stage of work execution (checking, report generation).
Service Requests
The AMAGE system, if the Service module is additionally enabled, makes it possible to create a service request directly from the inspection view.
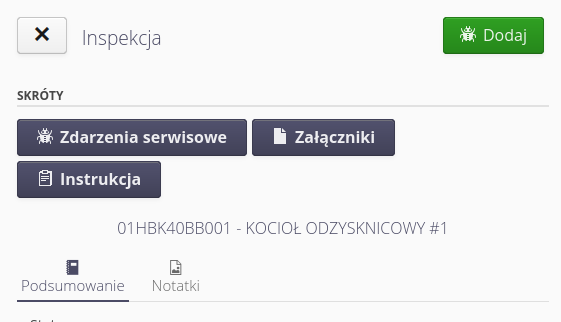
The Add button with the application icon opens the registration/save window. The relevant fields and the related request for the given inspection will be filled in automatically.
The ticket list button allows you to display all tickets in the system that have been pinned to a given inspection.
