Energy
Energy
Production data and energy management solution area. Available in two main menus:
-
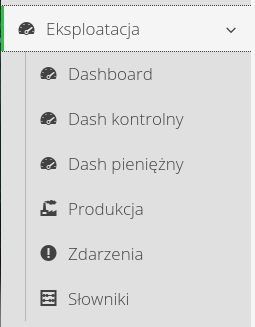
Operation - menu for the data operational area.
-
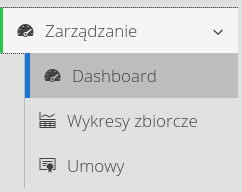
Management - menus for analytical areas and plan visualization
Dashboard
The mechanism of dashboards (visualization panels) allows for effective definition of visualization of production parameters and production plans. The definition of the appearance and presented data is completely under the control of users, allowing to create any views and sophistication of presented data.
By default, the system allows you to place projected dashboards in three areas of the main application menu: Operation, Management, Environment. The definition of dashboards is implemented in the dictionary definition area available in the Operation menu. After entering the dictionary definition, select the Dashboards button to access the list of defined/available items.
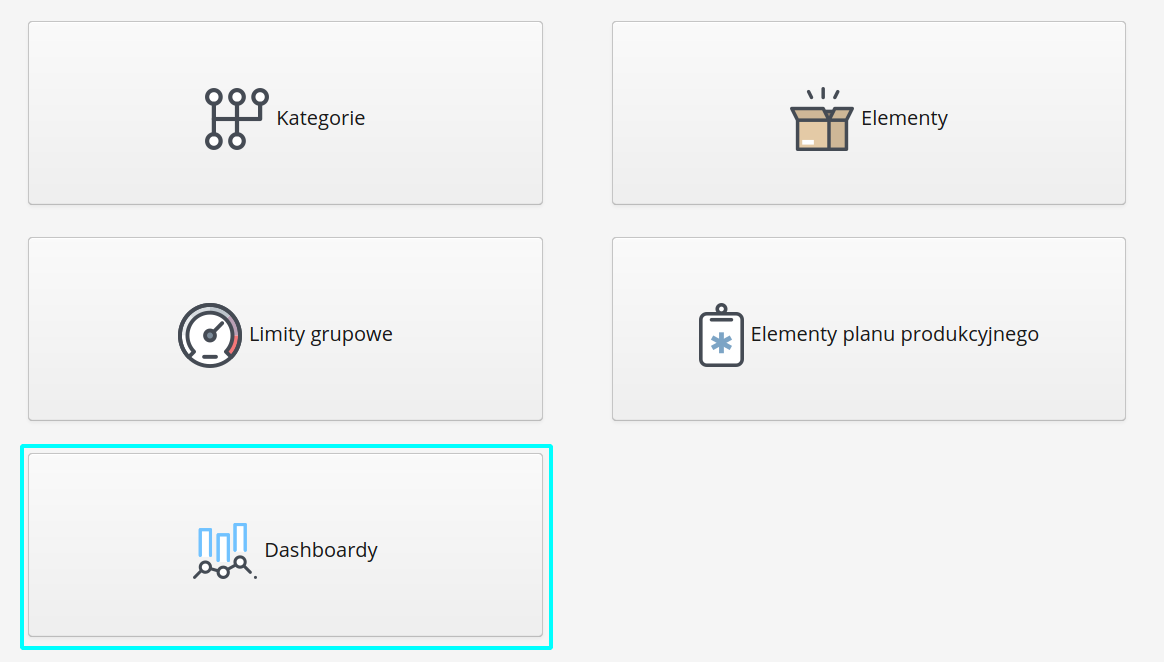
The list of dashboards shows all available dashboards in the system. For each dashboard, the menu target element in which they will appear is specified. Each dashboard will be a separate tab in the summary view. Using the Add button, we can add a new dashboard. The See allows you to view only one selected dashboard panel to check its presentation. The Edit button allows you to go to edit an existing dashboard.

The designed dashboard allows the presentation of any data in several forms of presentation. An example view of the designed dashboard with data collected from the entire system is shown in the figure below.
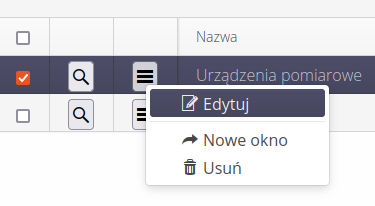
-
preview
-
edit
-
new window
-
delete
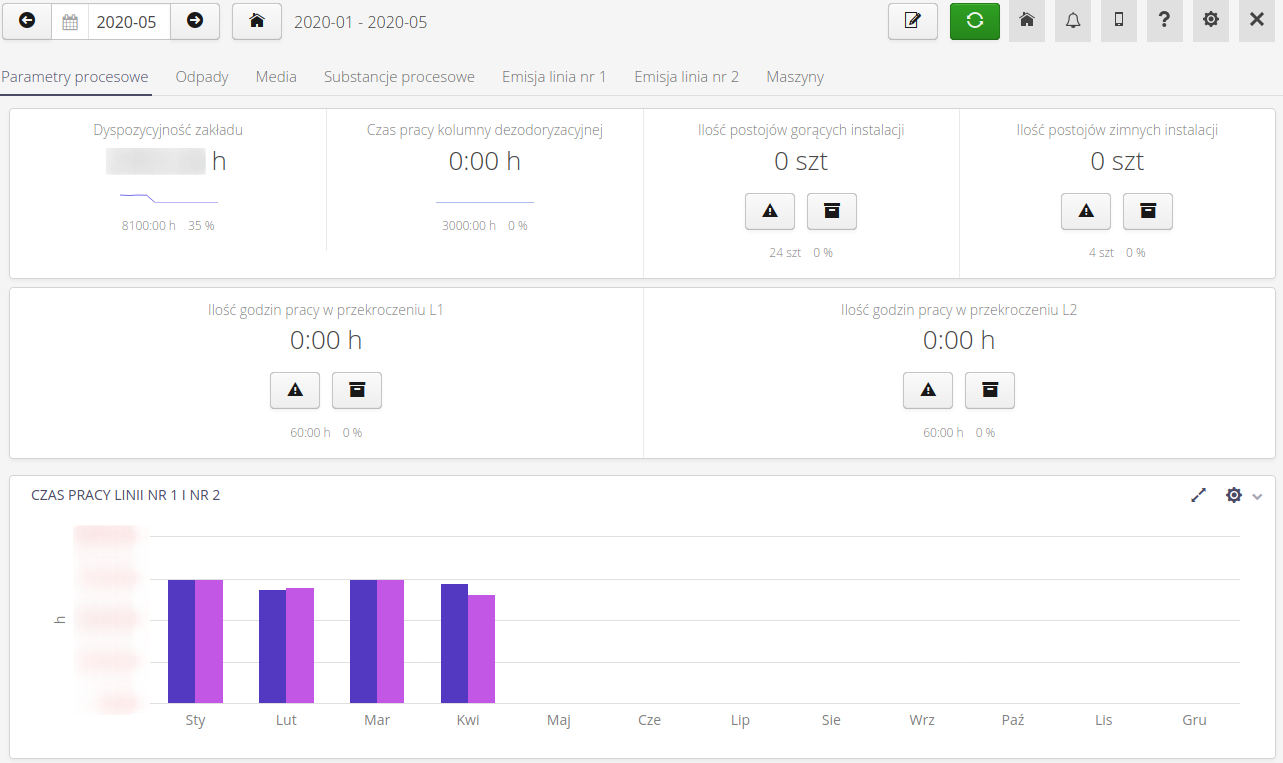
| Due to the nature of production data (time-based reporting - monthly, yearly, etc.), the dashboard visualization allows you to select the month of visualization. This allows you to display the data in tiles for the period you selected in the selector at the top of the visualization view. |
Dashboard design
Designing a dashboard is implemented through several dialog boxes. The basic data is determined after selecting the option to add a new dashboard or edit an existing one. In this view we specify basic information such as:
-
In which area the dashboard will be presented - Environment, Operations, Management
-
The name of the dashboard header
-
The order in which it will be placed in the list of visualizations
-
Lists of dashboard lines and items within a line.
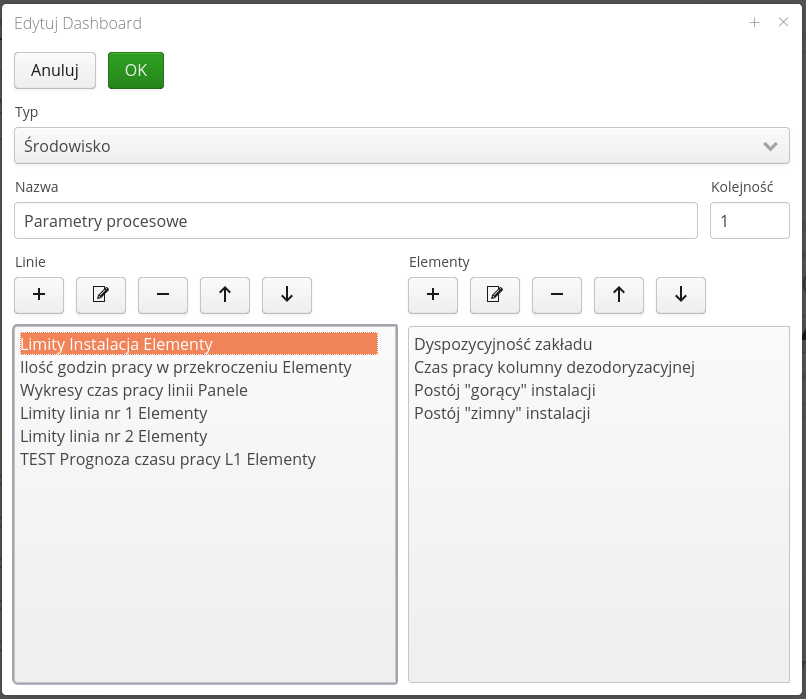
For the dashboard, we can specify the type of time filter. Whether it is a filter containing only a year selection, whether it should be year-month or another more accurate one. How the data is filtered and displayed depends on this.
The dashboard is designed by specifying the content of each dashboard line. A dashboard line is a set of tiles, which are placed in one section. The system tries to automatically adjust the number of tiles to the available space by expanding/decreasing the tiles accordingly.
Two types of lines are available: elements and panels. Elements are a set of controls that contain a set of visualization data but are not zoomable. Panels are a set of controls that contain more data or are presented in such a way where it is important to be able to enlarge the view to full screen and export the data. Typically, panels are used to visualize charts and tables.
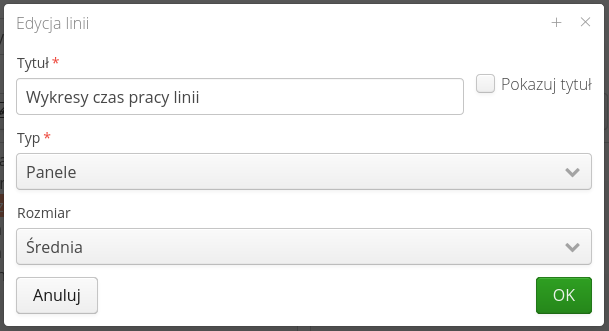
Editing a new line involves specifying its title, the option whether to display the title in the visualization, the type of line and its size (important in the case of panel-type lines) - this determines the vertical, default, size of such a line.
Each line consists of a list of elements/panels. Depending on the selected system type, it allows you to add data from the list of available visualization styles. After opening the window for editing a line item, we can define the method of presentation, the title of a given tile. If you select a type of panel/element, the system each time presents a preview image of a sample view of such a tile.
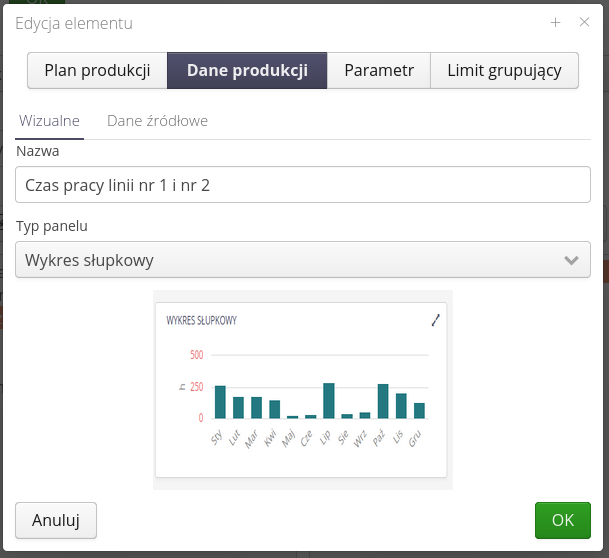
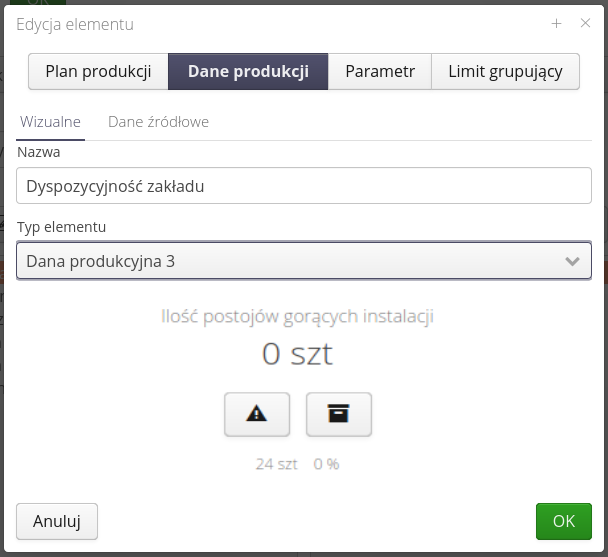
For each item, it is also required to specify the data source from which the data for the visualization comes. Depending on the tile/panel visualization type, the user can select the data source from: Production Data, Production Plans, Resource Parameters or Grouping Limits. Depending on the visualization method, one or many such parameters can be selected (tables, charts allow you to collect multiple data into one chart)
| When visualizing a production data tile, the system automatically hides the limit value in the production data tile view if the item does not have such a limit specified. |
In the dashboard, display an appropriate message when a tile does not have production data history for a given month
| Production data display tiles, depending on the configuration, allow access to the parameter entry history and allow to enter new values (e.g., for event-recorded data). |
Composite charts (multi-charts)
The module allows visualization of production data/production plans with complex charts and their flexible configuration. The module is used to implement flexible data analytics entered in the system with production data and production plan.
When the module is opened, the system does not display any chart. At the top of the window, selectors of previously saved chart sets are available. After selecting any and accepting it with the View button, the chart will be loaded. The New button allows you to create a new chart view. The → button allows you to hide the configuration panel for each chart so as to increase the space for data visualization.
After selecting any chart or creating a new one, the rest of the window is loaded. The main area of it is occupied by the chart. In the right part appears a configuration panel that allows you to configure the chart and data.
The data available in the side panel allows you to:
-
Save - saving the current view for later use.
-
PDF - export view to PDF/print format.
-
Excel - export the visible data as an XLS sheet for further processing/editing.
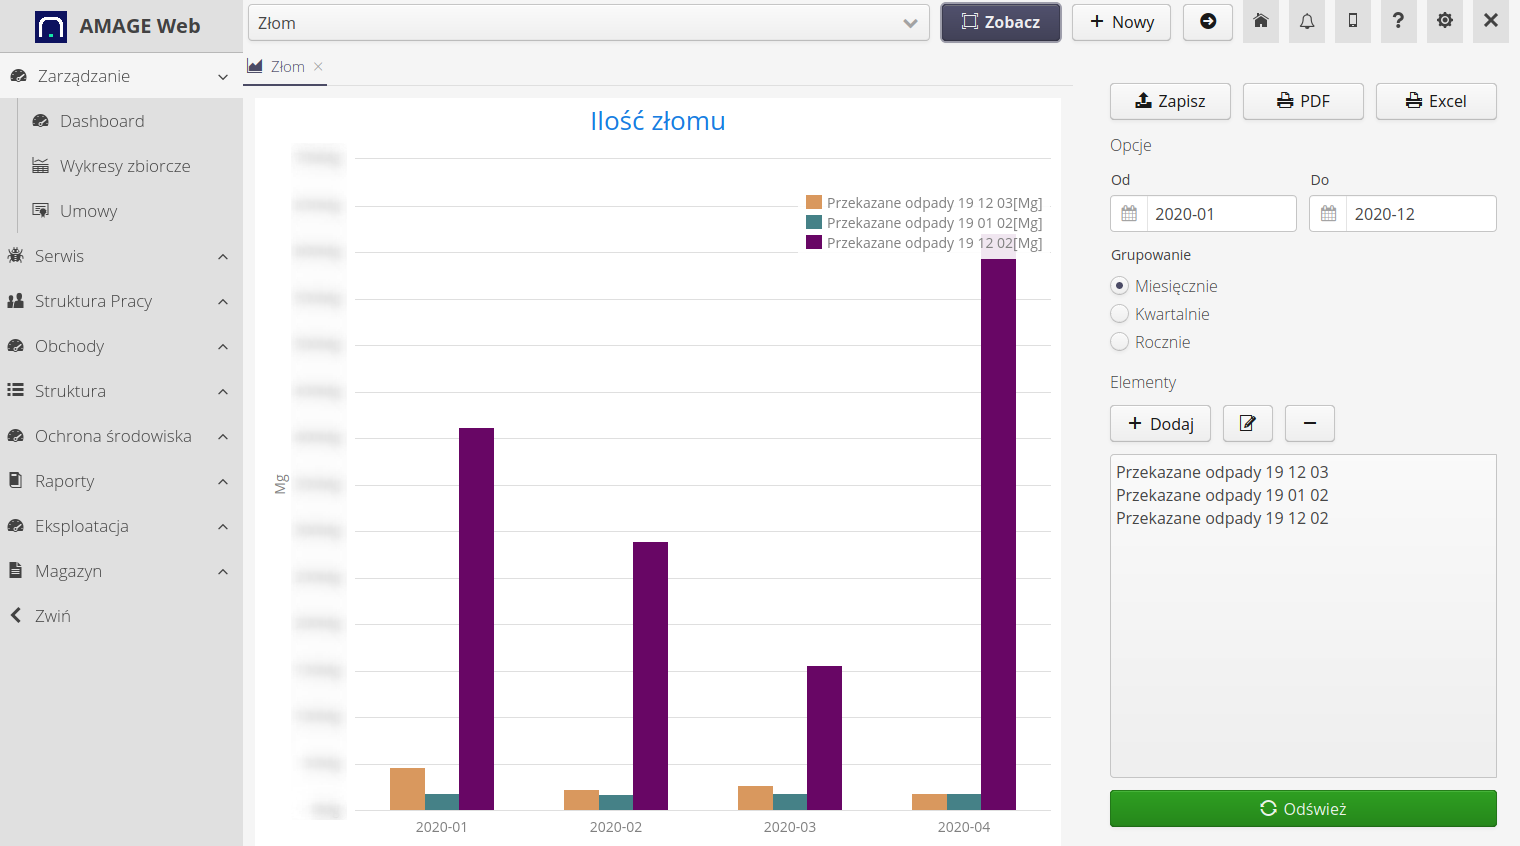
Additional options related to the presentation of the chart are:
-
Determination of the dates of the analyzed data (from-to)
-
Define data grouping - whether the chart should have grouped data in monthly, quarterly or annual format
-
Configuration of parameters that are displayed in the chart view.
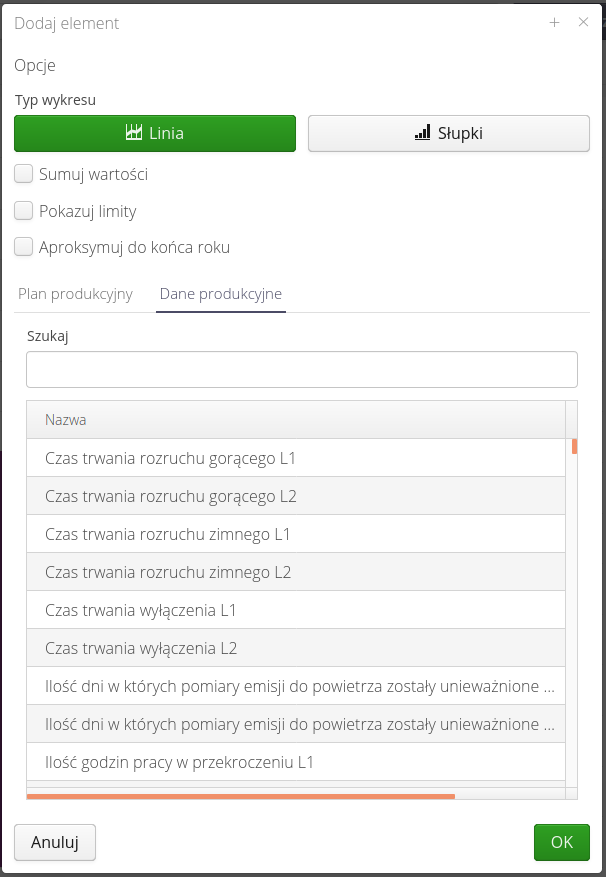
Parameters after selecting the add/edit option displays an additional configuration window. The window allows you to:
-
Determine how the data is presented - line/bar chart.
-
whether monthly data are to be added (incrementally) in subsequent months
-
whether the system is to approximate the data (linearly) to the end of a given calendar year
In addition, the user selects one parameter from the production data, production plan or asset parameters serving as the data source.
| Chart formats can be combined, i.e., one data can be plotted as bars and the other as lines on one chart. The system also automatically and intelligently selects the value axis by combining data with the same units on the same axis. However, mixing multiple parameters with different units should be taken into account, as this will result in multiple axis descriptions/scales. |
Reporting and analysis of production data
Analysis and reporting of production data in the field of energy production allow monitoring of freely definable parameters of plant operation and monitoring of their reporting. Based on the entered data, it is possible to generate data necessary for external reporting to institutions responsible for monitoring e.g. environmental parameters.
The start screen is a general view of the production data of interest. A visualization dashboard is available in the menu under the 'Production' link. Depending on the system configuration, information about key parameters appears on it.
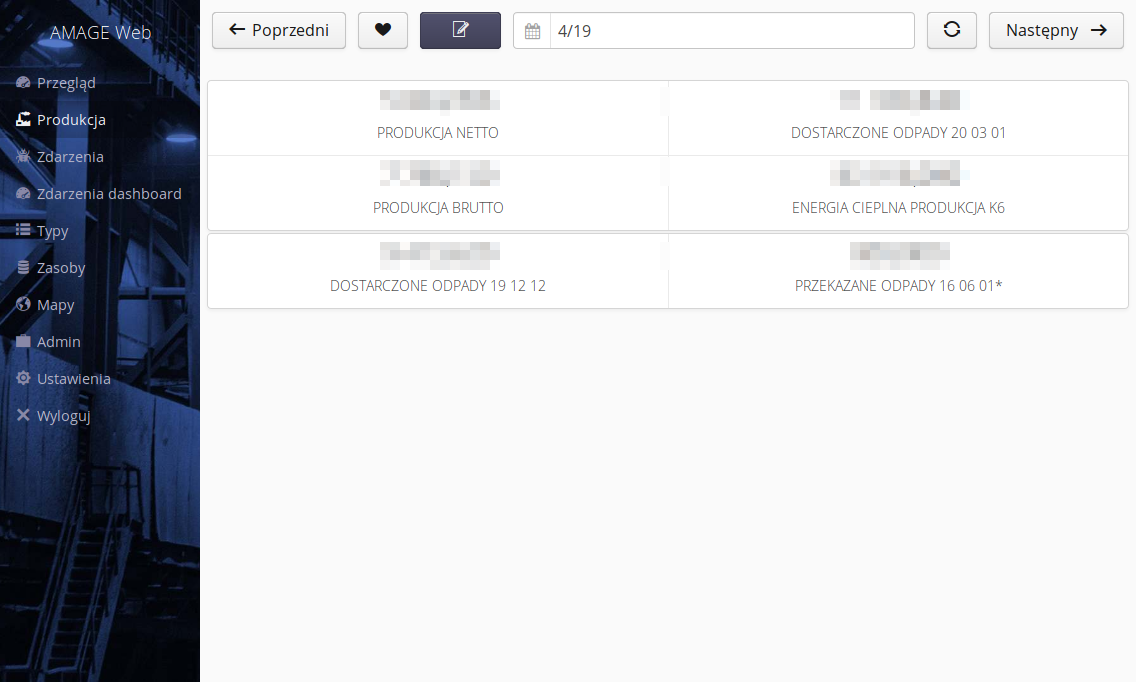
There are buttons on the top bar: * To navigate between months. By default, the current month is loaded. * to choose a month from the calendar * view refresh * Move to the detailed monthly view. The button takes you to the details of a particular month.
The default view is the view of the current month. Use the navigation buttons to move forward or backward to the selected/other month. Selecting a button with a heart icon allows you to view your own parameters specified as favorites.
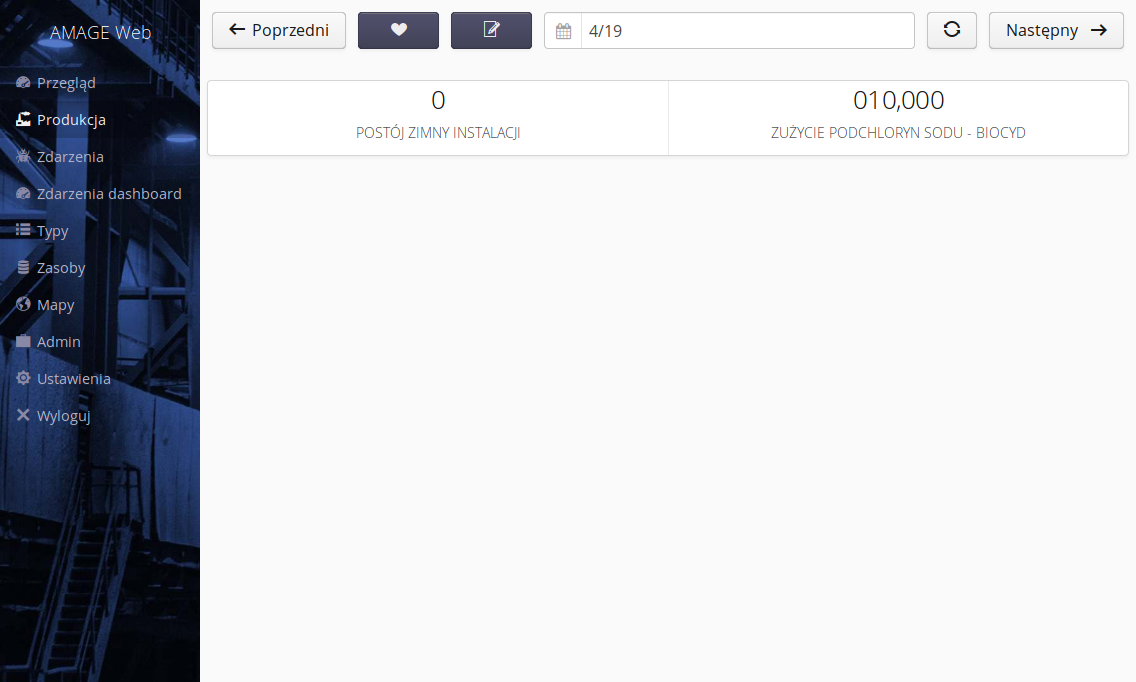
| Configuration of visibility of global parameters and favorites is described later in the documentation. |
Annual data view
Selecting the Energy → Production section from the main menu will display a view of the parameters in a yearly context. By default, parameters for the current year are loaded.
| Favorite parameters and their visibility are defined for each individual user. Everyone can have their own set of parameters that are most relevant to them. |
All parameters that have been defined and are set to be visible in the annual summary appear in the data cells.
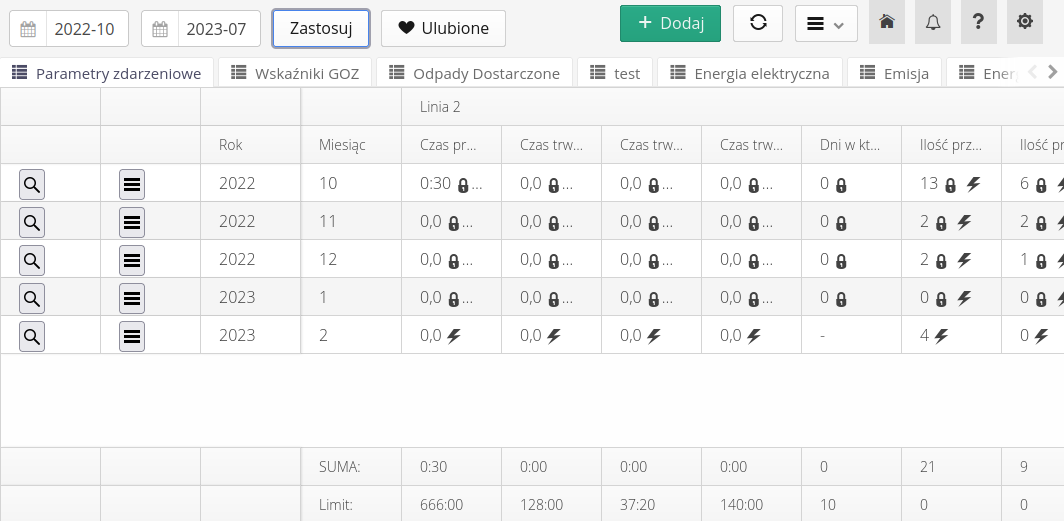
| To select a range, choose a date range and then select the 'Apply' button |
Selecting a different date range will reload the information stored in the system. In addition, selecting the 'Favorites' button will switch the view to the parameters that each user has independently specified as favorites.
In the advanced filter - hidden panel 'Filter', advanced filters are available, among others, filtering by selected parameter category.
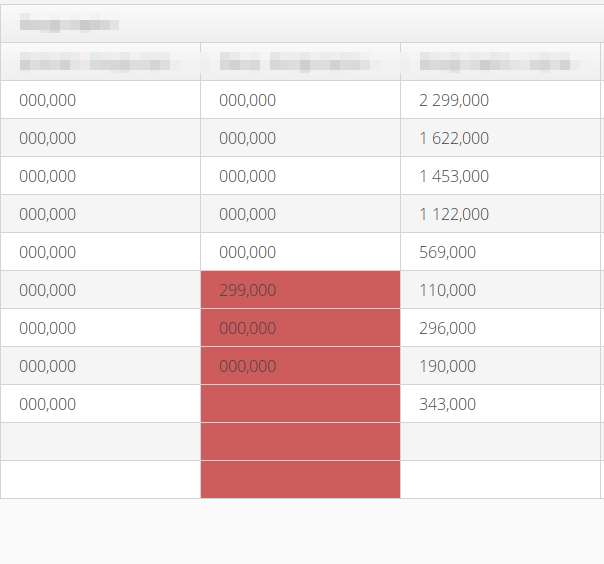
The parameter list has a summation row that totals the value of each parameter at the bottom of each column. The table also has support for definable limits and warnings for parameters. If a parameter exceeds the definable warning limits, the cells will be colored yellow (warning) or red (alarm). Limits and thresholds are defined in the parameter settings.
If a parameter in a certain month reaches a value defined as a warning or alert against a given annual limit, the cells of the parameter in question will be marked in yellow (warning) or red (alert).
View of monthly data
Selecting the 'Edit' button in the dashboard view or selecting any month in the summary table takes you to the monthly view. After selecting the monthly data, the detail view of the month’s data is loaded. The data is divided into sections. Each section has a header that has information about:
-
the name of the section in question
-
An icon indicating whether a section is fully completed (list icon) or any parameter from a given category in a given month is not entered (strikethrough icon).
-
background color - if the background color is light, it means that in a given section there is no parameter assigned to the current user that is not entered. Red color means that in a given section the user must enter data.
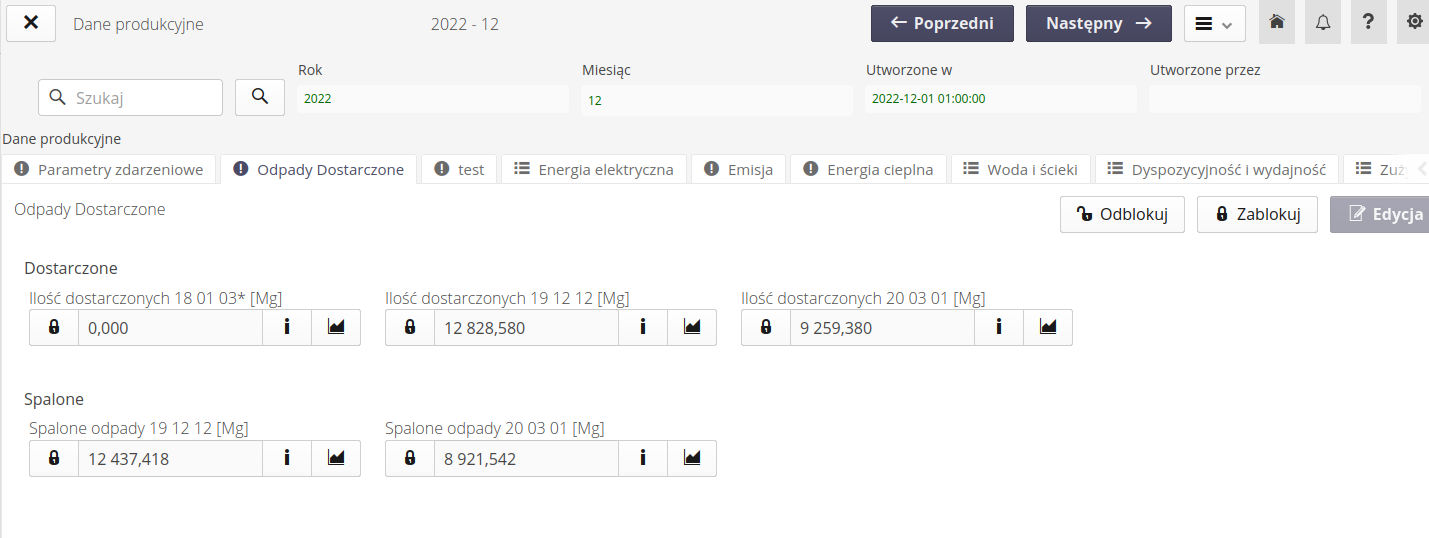
When a section is selected, it expands and shows all the parameters assigned to it. Each has a value and two buttons associated with it. The value in case a user is responsible for it and has not been entered has a red border. The section also has an edit button for the section in question.
| The edit button can be locked. This means that a given month is locked for editing. Only a person with authorization can unlock a given month for editing. This person should be contacted for such an operation. |
Each parameter consists of several components:
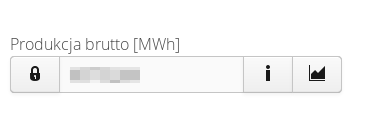
-
padlock button - lock/unlock the parameter
-
parameter value and description
-
additional information button
-
time domain graph button
| Parameter blocking allows authorized users to block access to edit a parameter and not allow editing after the approval of data, for example, from a given month. |
If the value of the parameter for a given year exceeds the limits, the field is colored yellow (warning) or red (alert), respectively.
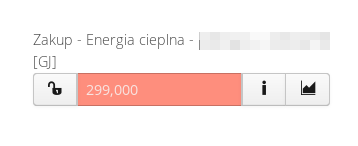
After selecting the information button, a window appears with basic information such as parameters, responsible persons and set limits for the parameter in the current year.
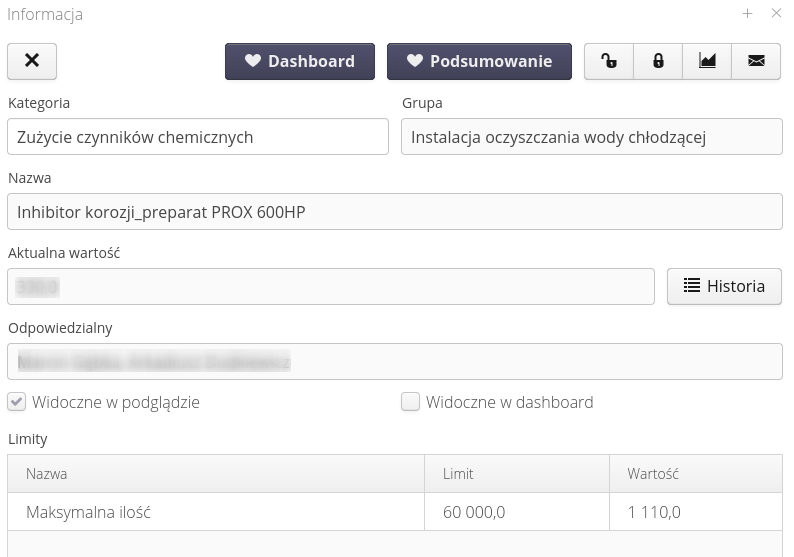
In this view, we can block/unblock data entry for this parameter in a given month. We can call up the chart window in the time domain or add/remove a parameter from the list of our own favorites.
The window additionally presents information on whether the parameter is configured to be visible by default in the annual preview and in the startup dashboard (data set by the system administrator). The limit and warning and alarm thresholds are also visible. The data is displayed only if the parameter has a set limit.
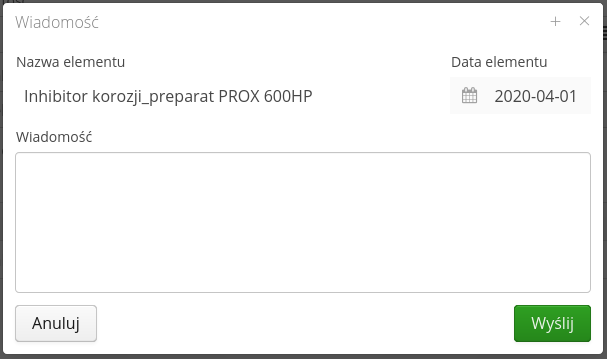
Email notification - when the mail icon is selected, a window opens with the possibility of notification by email messages to people who are assigned to the parameter. The message is sent to those responsible for entering the parameter. This can facilitate sending information about a potential error in the entered data or the need to enter data.
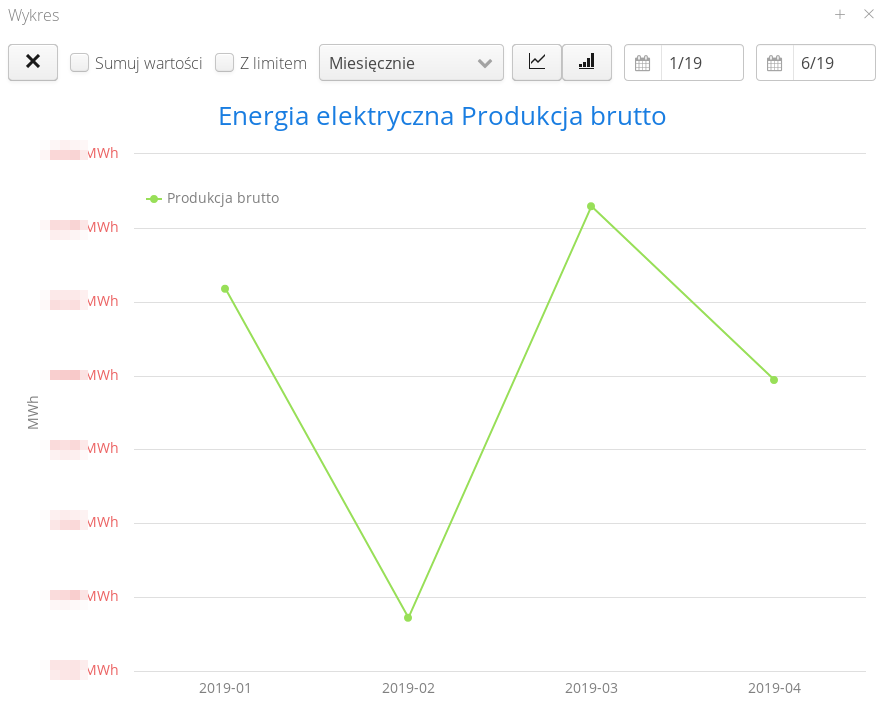
Selecting the chart button opens the chart visualization window. By default, the period of the last year (12 months) is loaded. The chart can be parameterized using the options available in the upper bar of the window:
-
Summarization - causes monthly summation of the entered values
-
Display limit line - displays an additional line indicating the chart in a given year - only for parameters that have such a limit
-
Period - summing up data over a monthly, quarterly or annual period
-
Chart type - line/bar
-
Date range for visualization
After selecting the 'History' button, a window opens showing the history of data entry for a given parameter. Information about the entered value, the person and date of entry, whether the entry results from event reporting and whether it is correct are displayed. Access to attachments entered during event registration is possible by selecting the Show button in the Attachment column. This allows you to add files, but also download, preview or delete them.


For event cases, the data entered as event parameters allows you to modify the actual value displayed as the value of the parameter in the monthly view. This is what the information displayed in the history view is for, if we show it for this type of parameter.

The system indicates:
-
The current value of a given production parameter for a given month
-
The value resulting from the sum of all events
-
Number of events
The user can mark it as incorrect for a selected history entry. Selecting the Delete button will mark this record as invalid BUT the record will not be deleted. Additionally, the value resulting from this history entry will be subtracted from the current production data value.
The user also has the option of converting the production data value for a given month to any value. By selecting the Convert button, the user has the option to enter a different value than the current value for a given production parameter AND a different value from the sum of historical records. This can be used to make a final adjustment to the value of measurement data resulting from arrangements with, for example, external companies/organizational units. In such a case, the Current Value will have a different value than the Sum from Events.
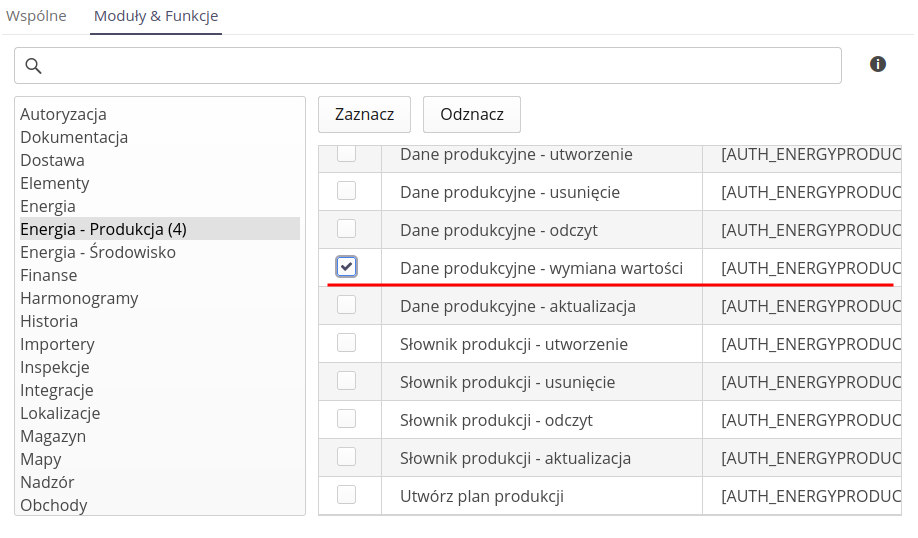
Changing the parameter value requires appropriate permissions. In order for the user to be able to make such a change, he must be granted the 'Production data - value exchange' permission.
| Please note that replacing values will mark all historical records as invalid. There is also a record in the event history to clearly explain this. |

Data entry
If a logged-in user is specified as the person responsible for specifying/entering a parameter, this is indicated in the monthly view, indicating which parameter has not yet been entered by the user.
To start entering data, in the monthly view, select the 'Edit' button in the selected section. A window will appear with the parameters entered for the section. Parameters that the user is required to enter have a red asterisk and are editable. Parameters to which the user does not have access are locked.
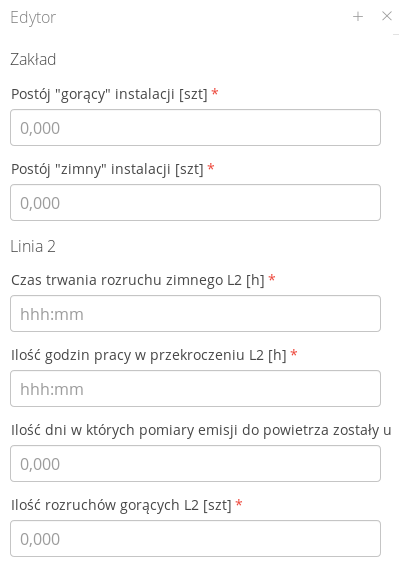
In the view, if a parameter has not been entered, a hint of the input format is displayed depending on whether it is a numeric or time type. After entering the data and confirming it, we go back to the selected monthly view.
Deficiency notifications for the month
The system automatically notifies users by email when data has not been entered into the system. Automatically, according to the settings, the system at the beginning of the month sends information to selected users about the lack of entered data, along with a list of parameters that have not yet been entered by the user.
Production data - configuration
System configuration is carried out by authorized persons. Persons with the ability to configure the system get access to dictionary definitions. This is realized by accessing the system from the main menu 'Energy → Dictionaries'. The view displays possible data for editing in the form of tiles. The basic data are elements and parameters.
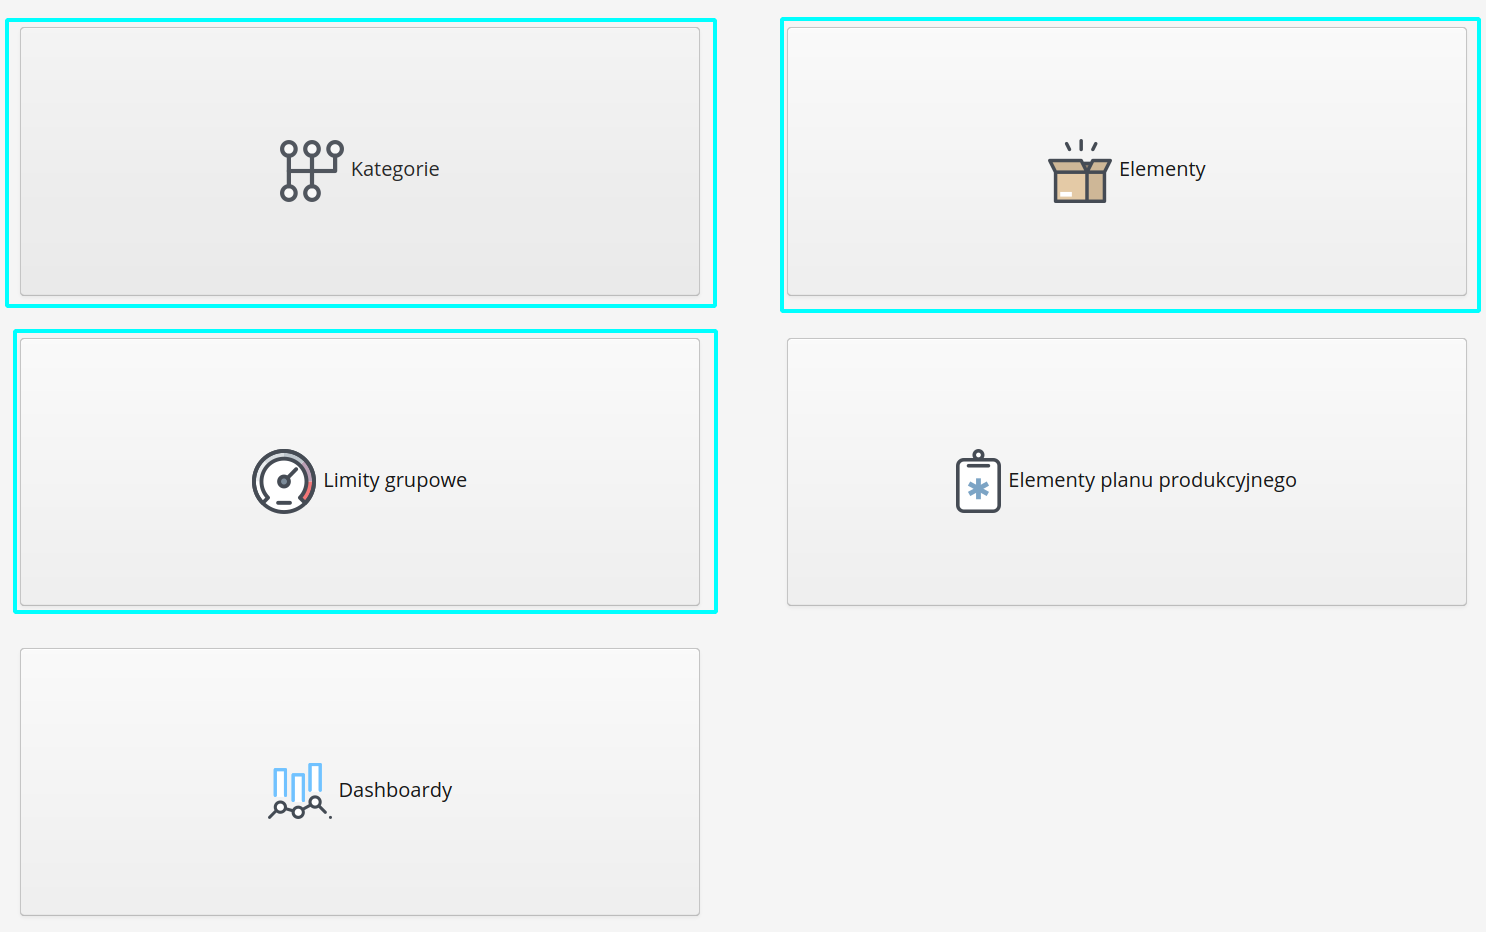
Categories
Categories of production parameters allow you to group parameters into categories and groups that facilitate the work on reporting individual areas of production data. The production data list contains both basic information such as the category name, but also the display order. Using the arrow buttons in the action menu, you can change the order of the event view.

Adding/editing takes place after selecting the Add or View action and then entering the edit mode.
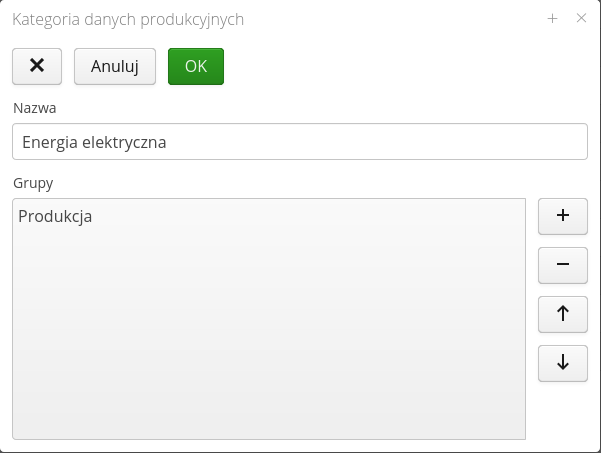
A category has its own name and a list of groups within the category. Adding/editing is done by selecting the appropriate actions from the available buttons.
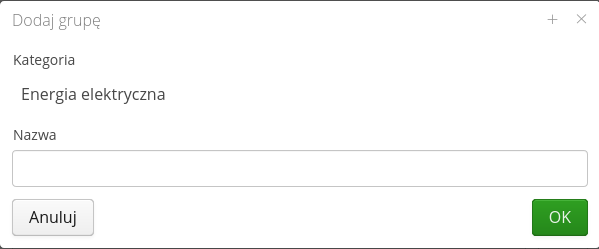
After adding the categories/groups, they can be used in the production parameter definition window to divide the production parameters according to the requirements/process division of the plant.
Production parameters
After entering the definition of elements, a window appears with the possibility of entering/editing production parameters.

To add a new parameter, call the action with the '(+) Add' button. After calling this action, the parameter entry window appears.
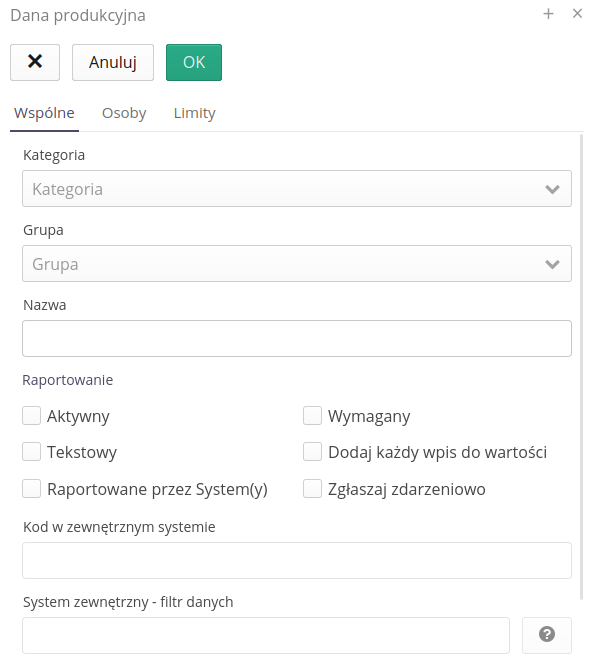
Each parameter has its own properties:
-
Category - category is used to group parameters, e.g., Electricity
-
Group - group, is a subordinate grouping to the category. You can define several groups within one category, for example, "Line 1/2/3".
-
Name - the name of the parameter
-
Code - identification code of a parameter. Used, for example, in integrations with external systems
-
Description - description of the parameter
-
Active - the active parameter is visible in all data views. Disabling this option will hide the parameter from the list. NOTE - the data and history of this parameter are not deleted
-
Required - specifies the requirement of the parameter. This parameter cannot be omitted when checking the completeness of a given month.
-
Text - the parameter is a text parameter and is not checked for limits and other numeric values. You cannot call the chart for this parameter.
-
Add each entry to the value - when reporting items, each subsequent entry will increase the main value of the parameter. Used when reporting individual activities and the parameter indicates the sum of values for a given month
-
Reporting through systems - reporting from external systems, e.g. through integration mechanisms. Displayed with the appropriate icon in the parameter list. Makes it easier to define and identify the data source.
-
Report on events - reporting is identical to reporting the addition of partial values to the main value. A parameter with this flag will be displayed in a separate view enabling event reporting, e.g. the number of occurrences of emergency events in the production process.
External Integrations:
-
Code in external system - code for the external integration system allowing to identify the values in the external system that will be added to this parameter.
-
External system - data filter - additional data filter for the external system. It allows for additional filtering of data from an external system using keys and parameters. Please refer to each integration system to configure this filter appropriately.
-
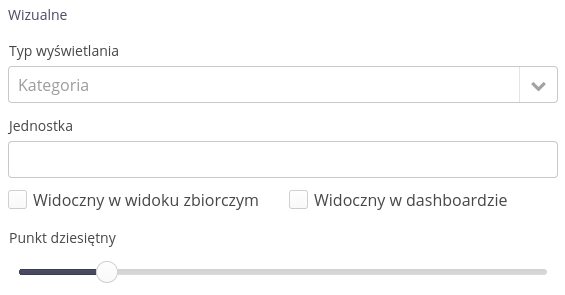
Display type - the type of data to be displayed. Causes appropriate formatting of data (number, time, text)
-
Unit - the unit of the parameter, presented in the value visualization areas
-
Visible in aggregate view - visible by default in annual view for production data.
-
Visible in the dashboard - visible in the startup dashboard.
-
Decimal point - the number of decimal places visible in all windows of the system.
For the integration system of production data from the GSW software, the ability to additionally filter data and determine the target production parameter has been added. Using the 'External system - data filter' option, we can indicate the code and value that will be included in this parameter. This allows you to enter a given parameter, e.g., data from a weighing system relating only to a specific supplier or vehicle.
| Internally in the database, the system records numerical information to 6 decimal places. The representation to the user is determined by specifying significant decimal places. |
In the 'Responsible' tab, the user has the option to indicate one or more persons responsible for the monthly entry of a parameter. This is used in notification mechanisms and production data checking.
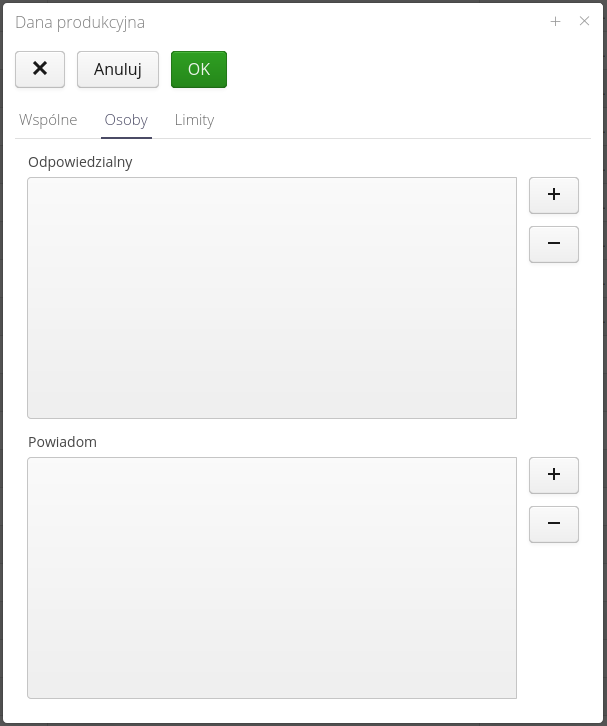
In the list of persons, we specify the list of persons responsible for reporting on a given production parameter. These are the people who have the authority to enter new monthly/event values for this parameter. A separate list is the list of notified persons - when users are added to this list, they will be included in the notification mechanisms for exceeding the limit of a given production parameter.
In the 'Limits' tab, you can define limits for a parameter in an annual period.
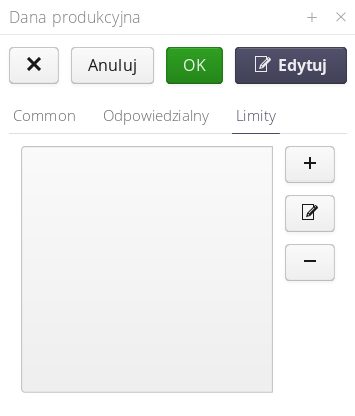
When you select the option to add a limit, a window appears for entering the value of the limit, the year of validity and optionally the percentage of thresholds at which the system will alert you if they are exceeded. Thresholds are given in percentages relative to the limit. The "ignore notifications" flag causes the system not to send information to users about exceeding the limit, despite the active exceeding of the limit (if the limit must remain at such a level due to, for example, arrangements with external entities)
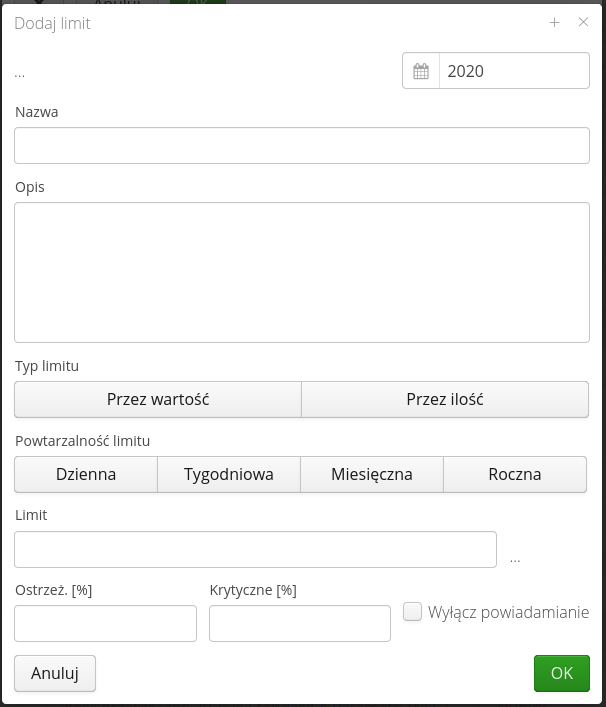
| The annual limit is treated as a limit for the entire year, i.e., the values entered for a given parameter within the scope of a given year are summed up and compared with the given limit and warning thresholds. |
Grouping limits
Grouping limits allows you to specify limits for several production parameters. This allows you to enter and monitor information that cannot be divided into a single production parameter. An example would be data on the delivery/consumption of certain materials resulting from an integrated permit. The data is reported as individual materials, the limit applies to the total. The system allows you to define and visualize the exceeding of such limits.
After selecting the section on grouping limits, you get a list of already defined limits. Adding a new limit is realized by the (+) button.

In the edit/create new limit view, we specify the name and description of the grouping limit, specify the list of production data that goes into the calculation of the limit, and define the parameters of the limit.
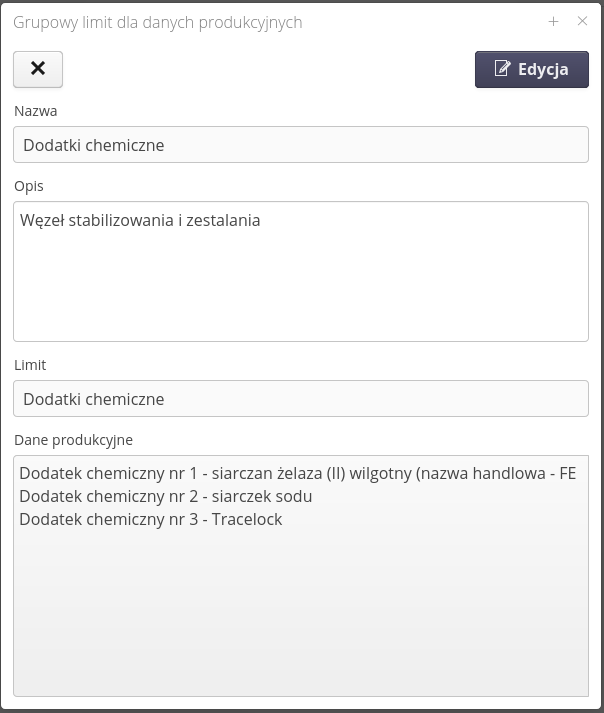
The limit parameters and their definition window is the same as the limit definition for the production parameter.
Production plan
The production plan definition and management interface allows you to flexibly define parameters that define the plan of any parameter in the annual/monthly range and then compare it to the actual operation of the plant using aggregation of data from production data.
The main purpose of production plans and their visualization is to be able to transfer to the AMAGE system the data that is usually found in many auxiliary sheets in an industrial plant. In the case of plant operation, the important element is to properly and reliably rely on the data available in the production system and to apply this information to the established plan (annual/monthly) so that plant operation can be quickly verified.
Access to the production plan definition data is in the Elements section of the dictionary data. After entering the dictionary data, select the Production Plan Elements button.
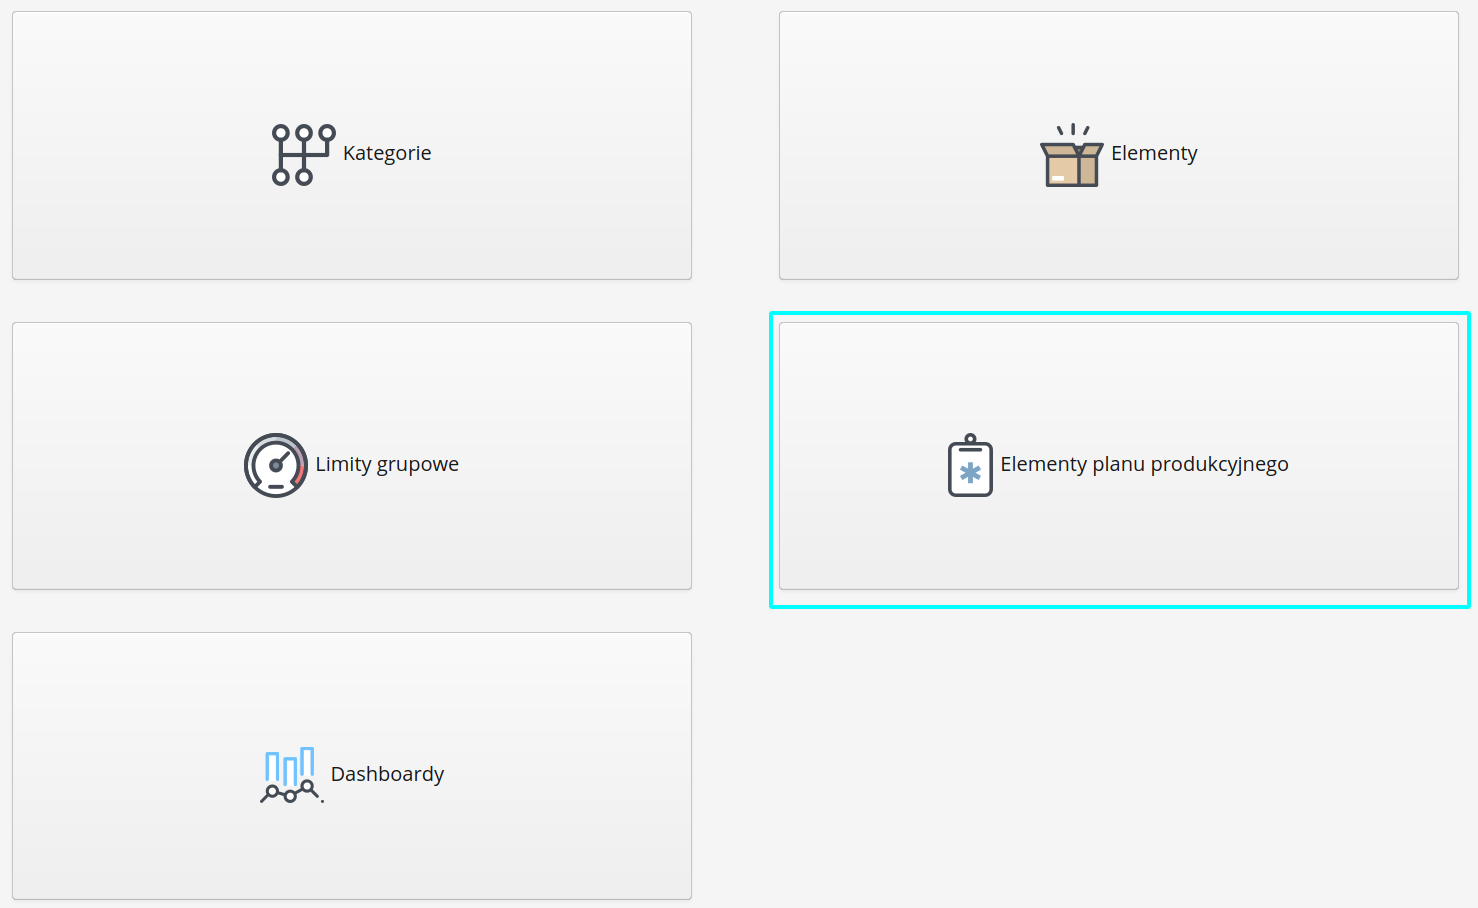
Entering this option will display a list of all available production plan parameters. They indicate the name of the item, its categorization and its arrangement in production data groups. Adding a new plan can be achieved using the Add action in the top view bar. Editing an existing plan parameter is possible by selecting such an item from the list.
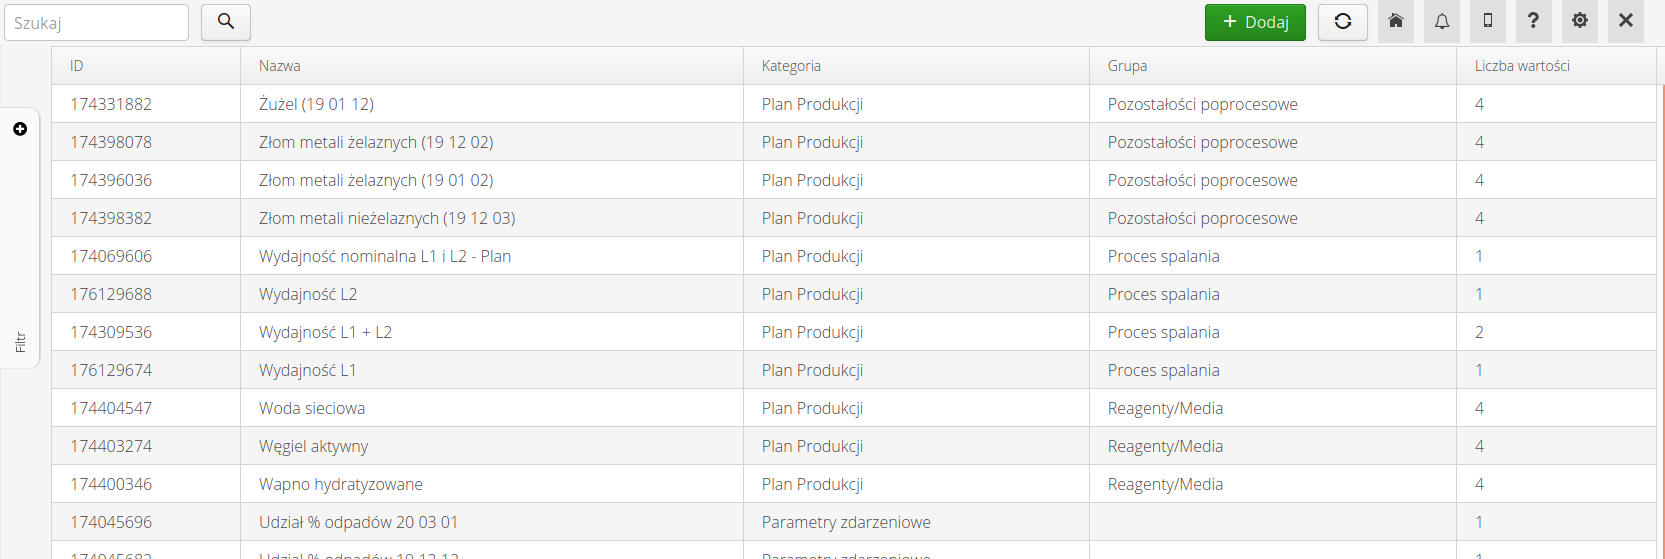
| Production plan parameters are available for use in dashboards, advanced charts and export mechanisms. |
Editing a production plan item is divided into two stages. In the first, we define the production plan parameter itself. Within it, we can define up to four dimensions of presentation of such a plan element. In the editing window, we can specify the name of the parameter and assign it to the appropriate group and category.
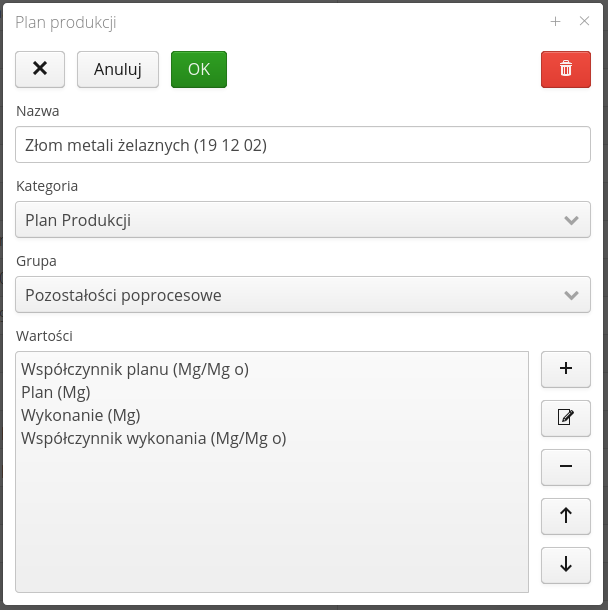
In addition, we can specify up to four different dimensions of the plan element:
-
Plan value - a plan value, is a value that determines the plan (assumptions) of a given plan parameter. Usually, it is a value that is assumed to be a fixed value or that results from some assumptions (other elements of the plan).
-
Performance value - a value derived from production/operation data. This is usually the actual value of a given production parameter at a given point in time and is derived from employee reports or integration with data from other systems.
-
Plan Value Factor - the plan value factor allows you to present an additional dimension of comparison. Usually it is a comparative indicator, which by means of a dimensionless value (or percentage) indicates the level of implementation of the plan against, for example, production data
-
Execution value factor - as above, but referring to actual production data.

Each dimension of a production plan parameter is an independent billing mechanism. After creating such an item or editing an existing one, we enter the editor of such a dimension.
The editor allows you to define the dimension to which it applies and edit the value of this element with the precision of any month of any year. Switching between years and months is possible through year selectors and individual month buttons.
The user can enter information about the result unit of a parameter and the number of decimal places to be used in visualizations of this parameter dimension.
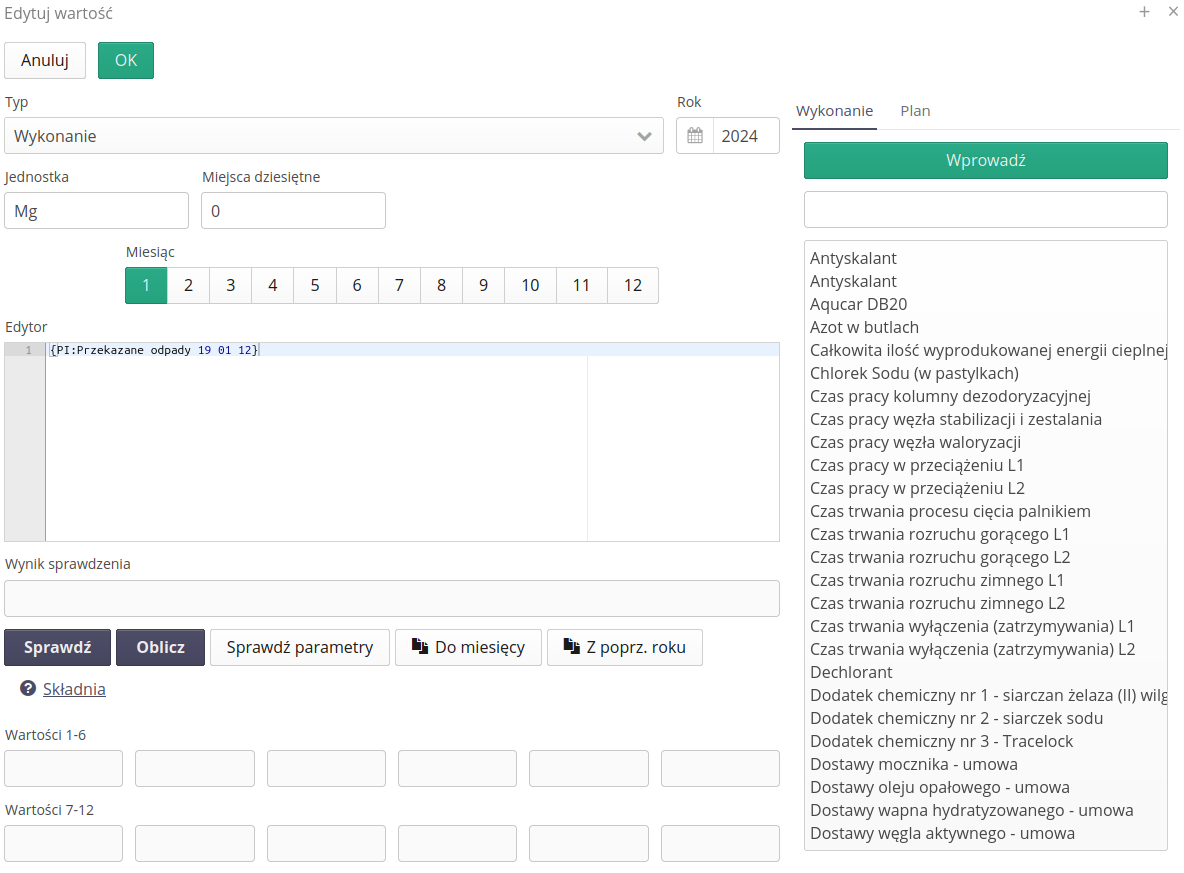
The editor is the main element allowing any modification and use of data both from plan parameters and directly from production data. Using the list of available parameters in the right part of the editor, we can enter them into the editor where they are currently selected. After selecting the Enter button, the current value is entered into the editor in the form of code {<parameter name>}. Using any mathematical operations, we can create the corresponding value calculation. The math engine is based on an advanced library of these functions. The documentation of this library can be accessed through the Syntax button below the editor. Additional actions available in the editor:
-
Check - performs an analysis of the editor and, if the values are correct, presents the result transferred to the math engine (the codes are converted into actual values for the month-year)
-
Calculate - calculates values for all months of the selected year and enters them into the controls below. Each control corresponds to one month.
-
To months - copies the current value entered in the editor to other months of the year.
-
From previous year - transfers editorial values from the previous year to the currently selected one
-
Check parameters - checks the correctness of parameters in the editor and indicates errors in case of incorrect values. Searches for the existence of parameters in the system and indicates problems in case of absence.
Summary view of production parameters
Production parameter data has an additional summary view. Using this view, we can view data that comes from production data analytics in an aggregated view. Each element has an expansion displaying information about all components of a given production plan parameter along with a comparison with the actual performance derived from data acquisition.
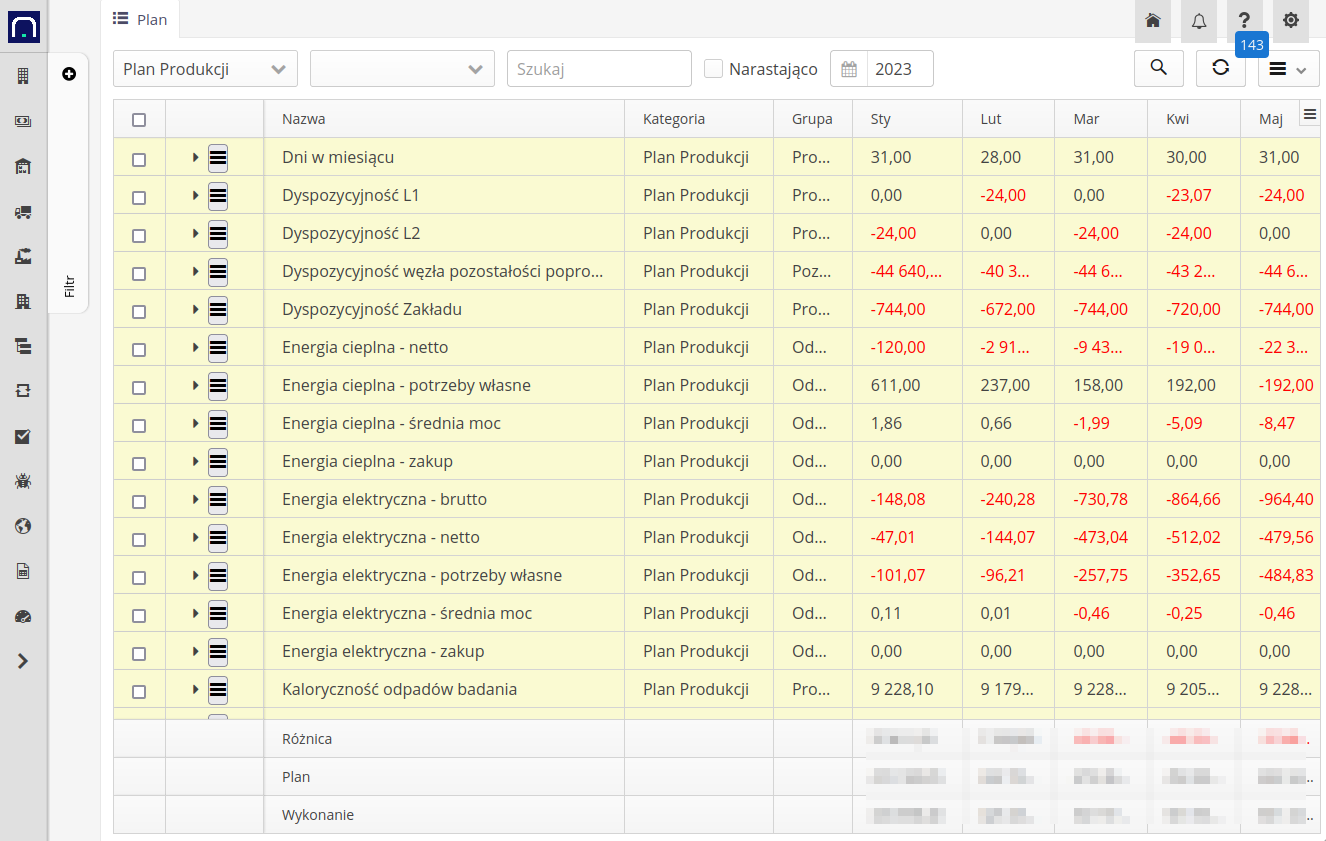
Event reporting
Production parameters that are designated as event parameters (in the production parameter configuration) allow their values to be recorded eventually, i.e. when they occur. The event reporting view is configured dynamically depending on the user’s data entry privileges.
Upon entering the module, a list of production parameters is displayed with the event reporting flag, to which the user has been assigned as a responsible person. The list is formatted in a tiled view. The data presents information about the given parameter, the current value of the parameter (for the current month), the number of registers of the given parameter entered in the given month, and buttons for accessing the reporting action Report and button for accessing the history of entries package icon.

The list can be filtered dynamically by entering data in the Search search field. After entering any text, the system automatically searches for parameters and filters them. The display of all parameters is realized by the Refresh button.
After selecting reporting via the Report button, the reporting window is displayed. In the window, you enter the date and time of the report, the current value of the parameter in question (depending on the type of parameter, these can be quantities, time or numerical value of the measurement), a note and possible attachments (confirmations, protocols, etc.).
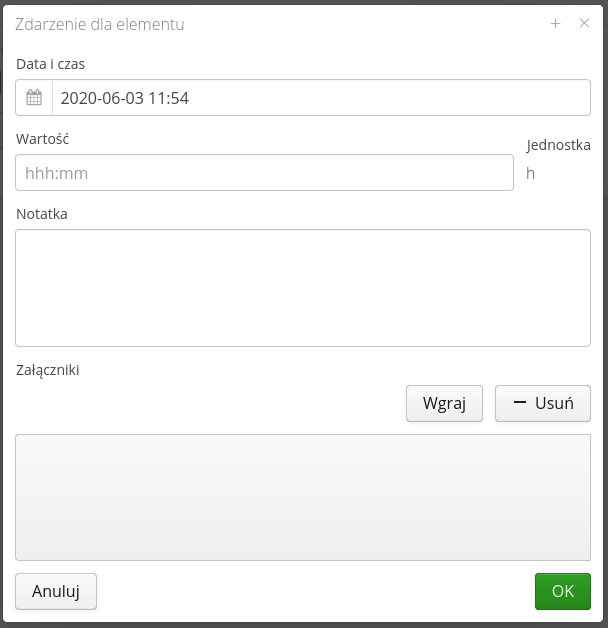
The data after saving is attached to the given production parameter and the value of the given parameter is the SUM of all entries.
| Event reporting is protected against reporting data not of the current month. When the reporting window is opened, the date range is limited to the month only. |
The historical data view is described in the production parameters view. It allows you to visualize all historical entries and make any corrections.
Visualize energy production
The visualization of energy production is divided into two available views. One designed as a control in the dashboard visualization and the other available in the management view.
Control Dashboard
The control dashboard is available as a dashboard for visualization on large-format screens. It presents information about plant operation with visualization of data such as:
-
current energy production (last 15 minutes) - thermal, electric with a breakdown into gross (produced), net (delivered to the grid) and own consumption
-
Historical energy production with estimated control algorithm in view:
-
Shifts
-
24 hours
-
The sidebar shows current and projected plant operation indicators along with information downloaded from DCS-type systems on process parameter properties (steam generation, etc.)
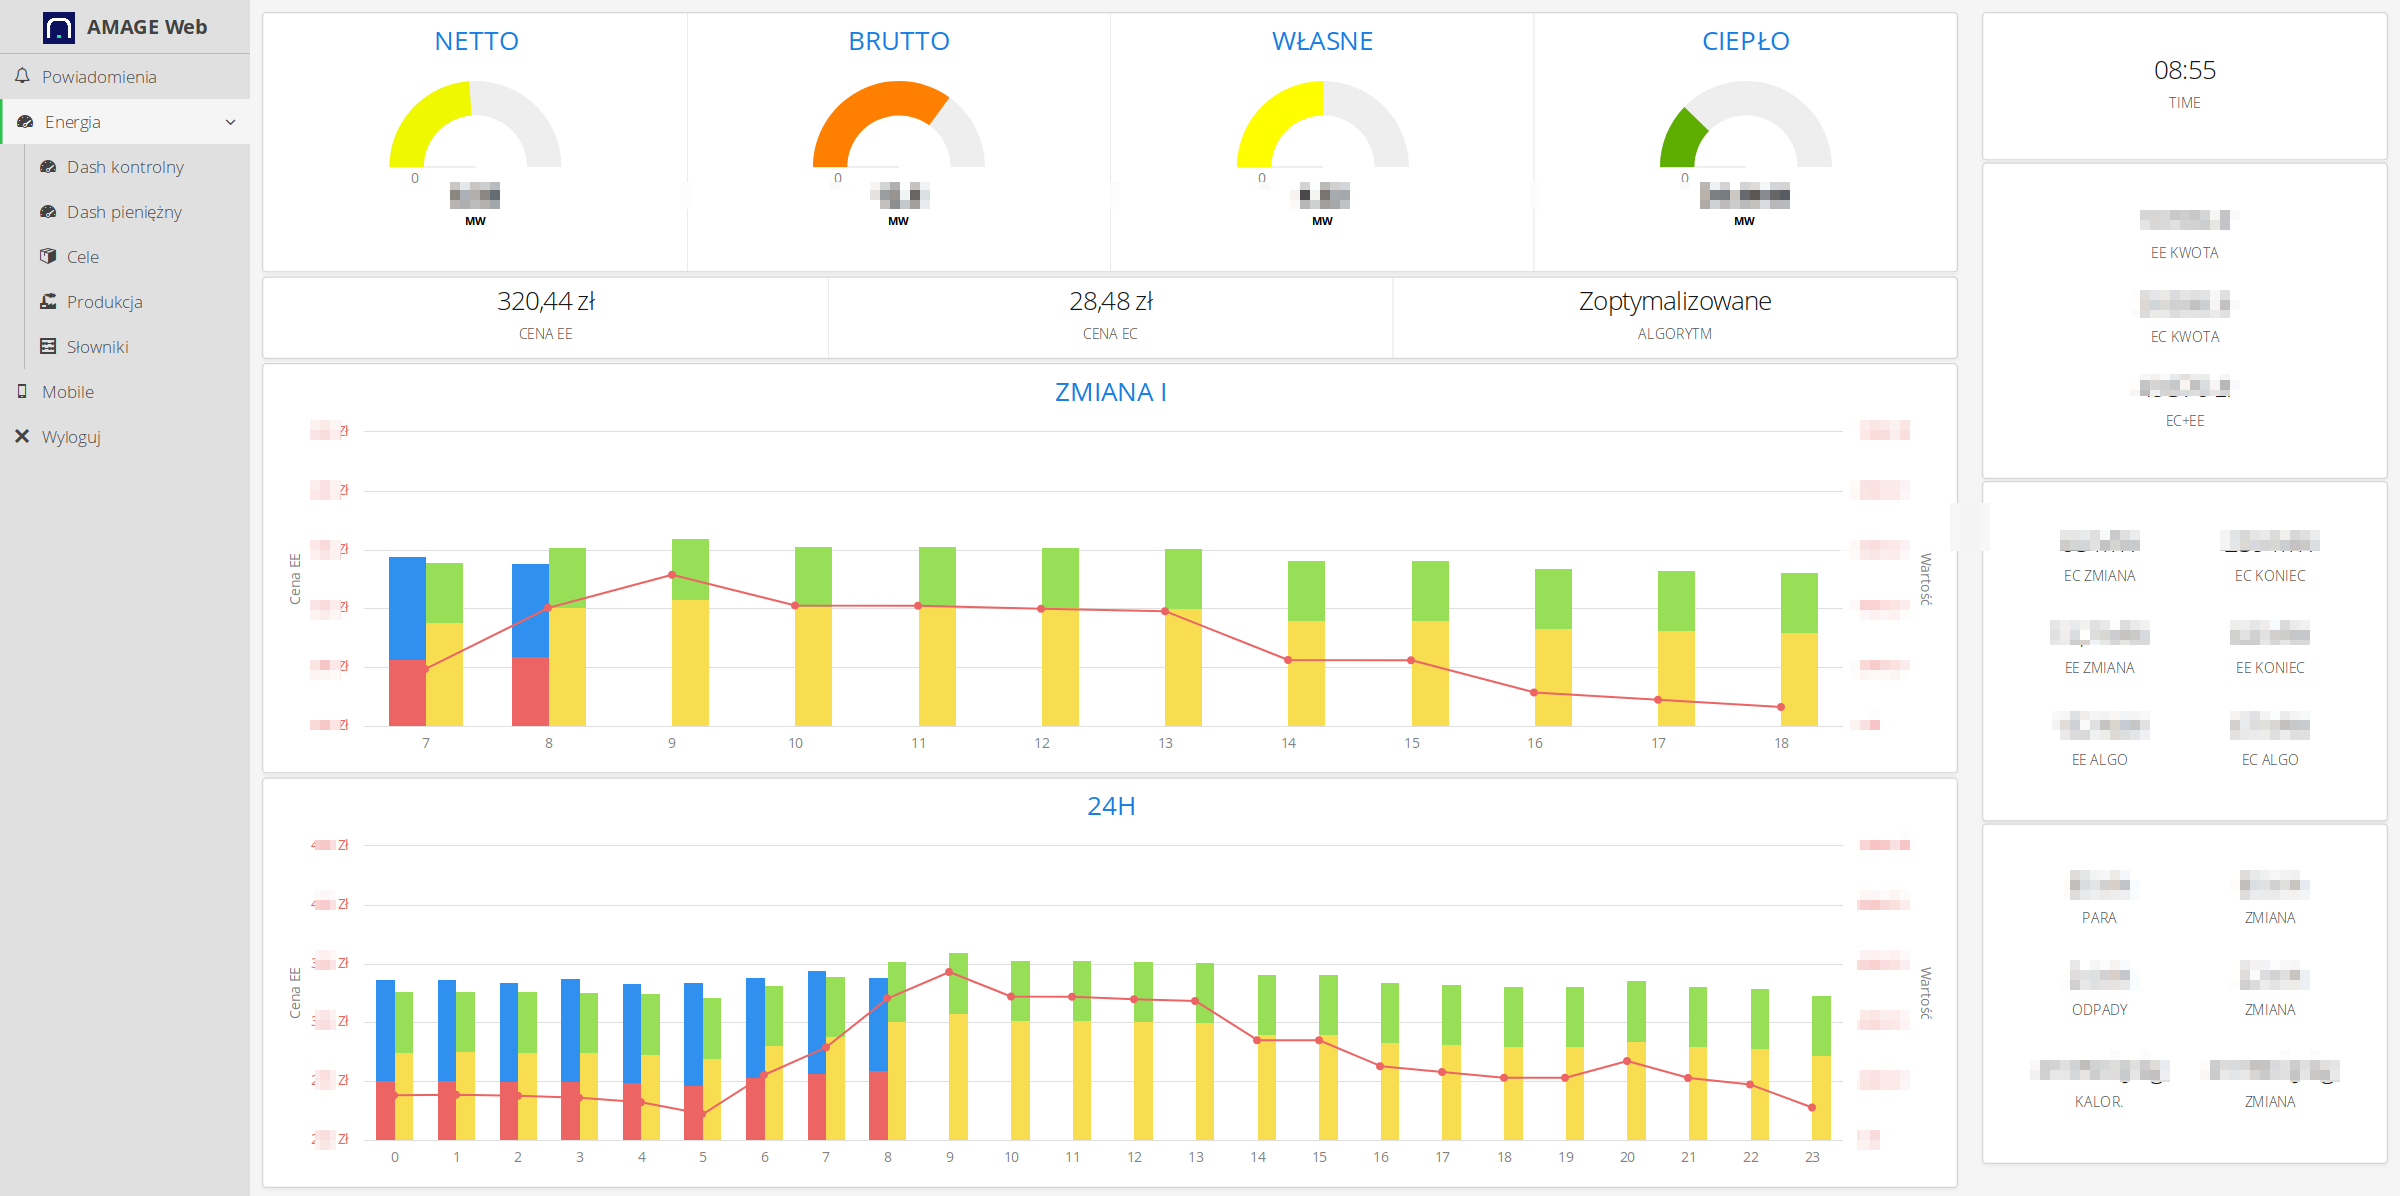
| The dashboard view is additionally available without additional decoration through the system address starting with the prefix /dashboards |
Money Dashboard
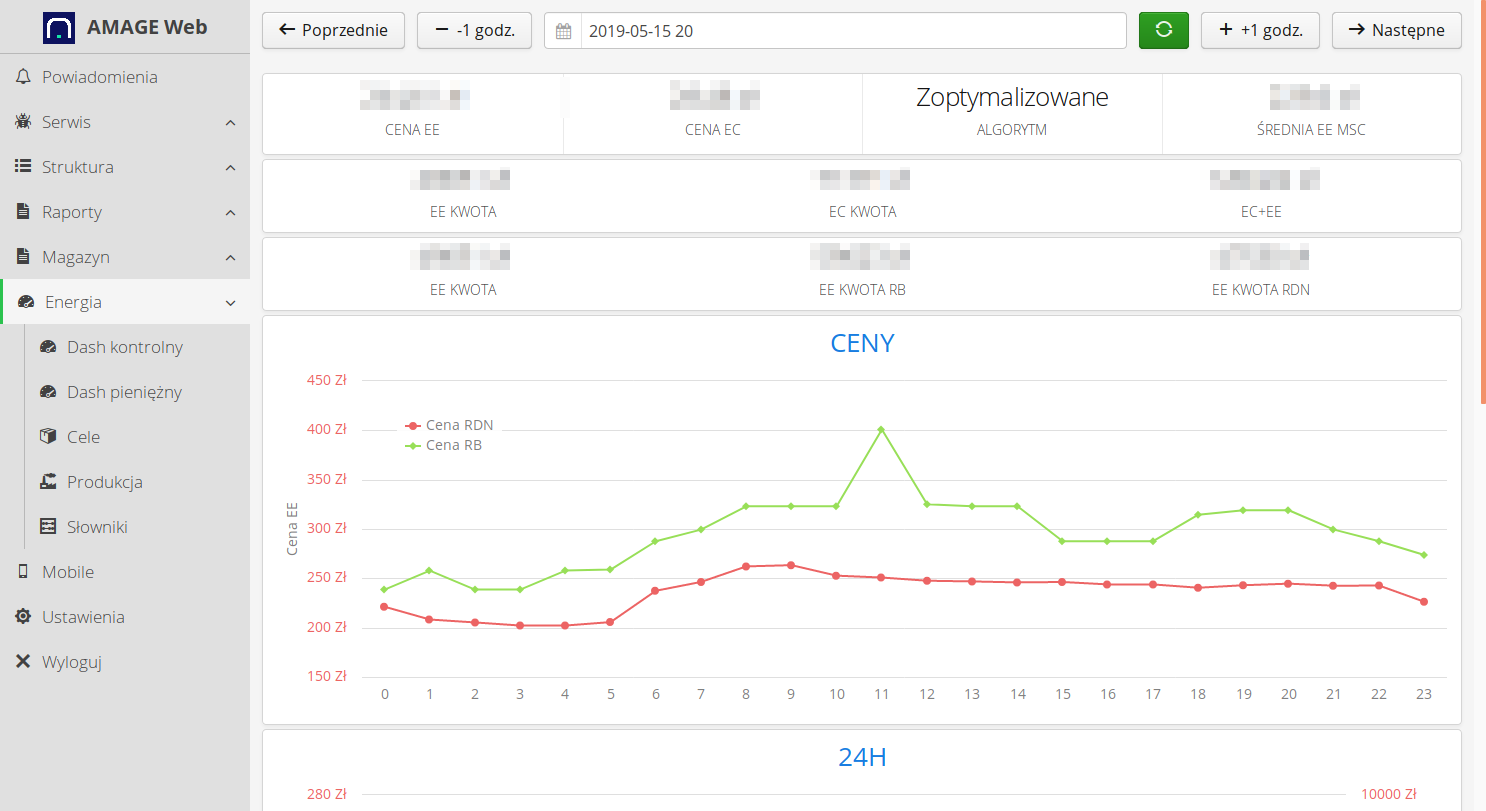
An analytical dashboard showing current energy production in a financial context. The charts show current production values and energy market prices: Balancing and Day-Ahead Market. These values are also presented in a financial context taking into account the current production and prices of both markets.
