Supervision analytics on the example of cable works
Introduction
The document describes the analytical view for the supervision module. This view allows you to view data on supervised elements in an overview manner, i.e. with a preview of individual supervision elements in the context of work progress for individual grouping elements, e.g. element types or material categories. The view allows you to perform data analysis collectively for a specific range of data in one place.
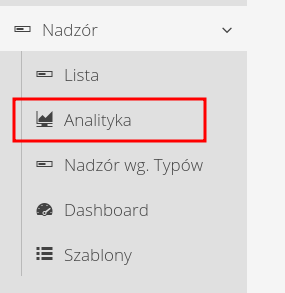
The supervision analytical view is accessed from the main menu in the Supervision section. Select the 'Analytics' option

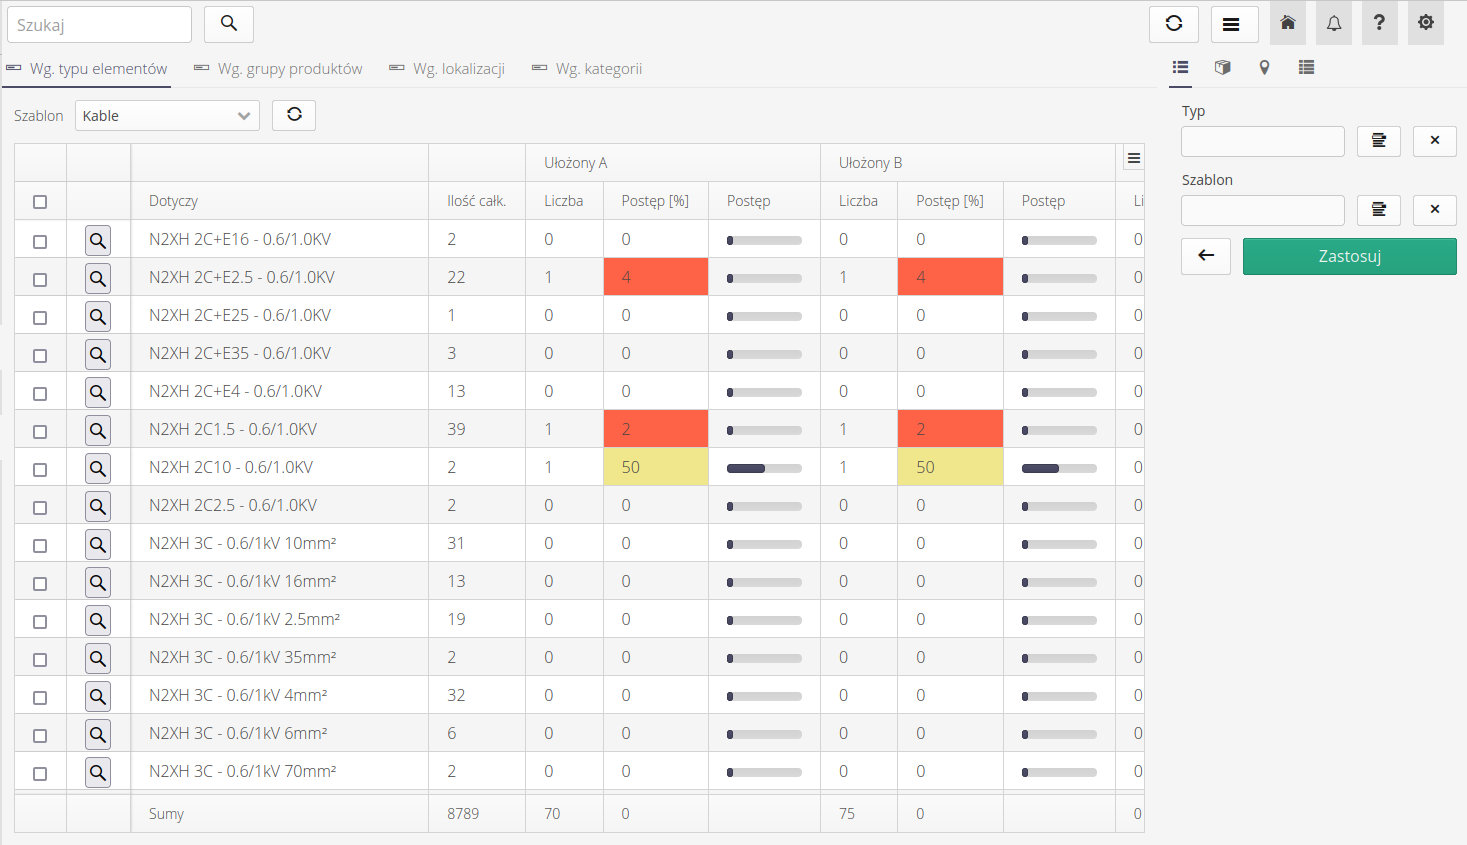
After switching to the view, progress visualizations are presented in individual plants in the form of tables and charts according to selected grouping criteria.

| In the supervision view, we have the ability to view all supervised items in the form of lists, calendars and maps. However, the view shows all supervised elements, which can be very large. As a result, you can lose the overall overview of the work progress. This is what we use the analytical view for. |
The analytical view of supervision allows access to a range of information grouped in various ways.

Available analytical views have the ability to present summary information about supervision against the following criteria:
-
acc. element type - grouping view according to element types
-
acc. product groups - grouping view by product groups to which a given supervised item is assigned
-
acc. location - a grouping view based on the location to which a given supervised item belongs
-
acc. categories - collective view grouping by categories of element types
Each such view additionally requires specifying in what context (supervision template) we want to view a given grouping. This is because if we have a resource in the system, we can initialize many different controls for it against any number of templates. For example, we can supervise a refrigeration device that is to be installed in a building against two supervision templates. One related to transport with states: ordered, in progress, in transit, delivered, mounted. And the second related to the connection process: mounted, connected, checked, verified. Therefore, when analyzing the view, we can view the status against any selected supervision template.

Each state from the selected supervision template has several cells that represent the state of those elements. We display the total number of elements of a given grouping, e.g. element types. Then, for each state, we calculate the current number of registrations of this state for resources of a given type and compare the percentage of the total number of elements to register the current state. This allows you to display the current progress of work and the progress of individual stages.

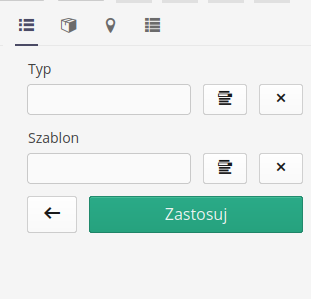
In the expanded filter, we have additional filtering options for the data that we display in the analytical view.

Each of the views has the ability to additionally export data to XLS format, filter/sort columns and go to supervisions of a given type.
Time progress
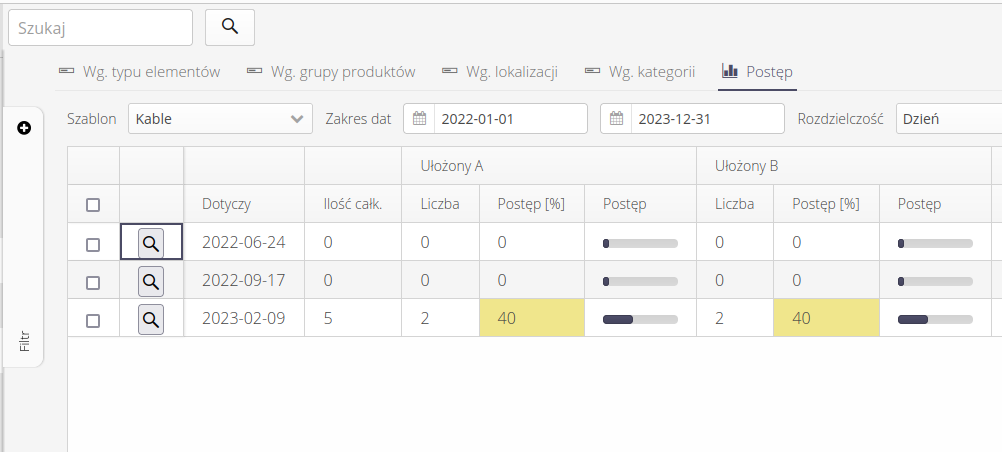
An additional view allows you to analyze the progress of work in relation to the time parameter. After selecting the appropriate date range and grouping - by day, week or month - the system generates information about the progress made in a given period of time.

At the bottom of the table, summary data for individual supervision states are displayed.
| Howto was created based on system version 1.20.0.0 (01/2023) and presents functions that may not be available on your system. Ask AMAGE about providing this functionality. |
| Due to the ongoing development of the system, some screens or configuration files may look slightly different, but will still retain the full functionality described here. This does not affect the essential functions described in this document. |