Leases - data analytics and dashboards
Introduction
The document describes the analytical view of leases. A view that consists of a set of data in the form of charts, tables and indicators that facilitate the financial analysis of the implementation of leases, including formwork elements. Using such visualization and dashboards, the user can quickly check the financial result of a given contract and compare offer, design and implementation data.
Analytical view of tenants
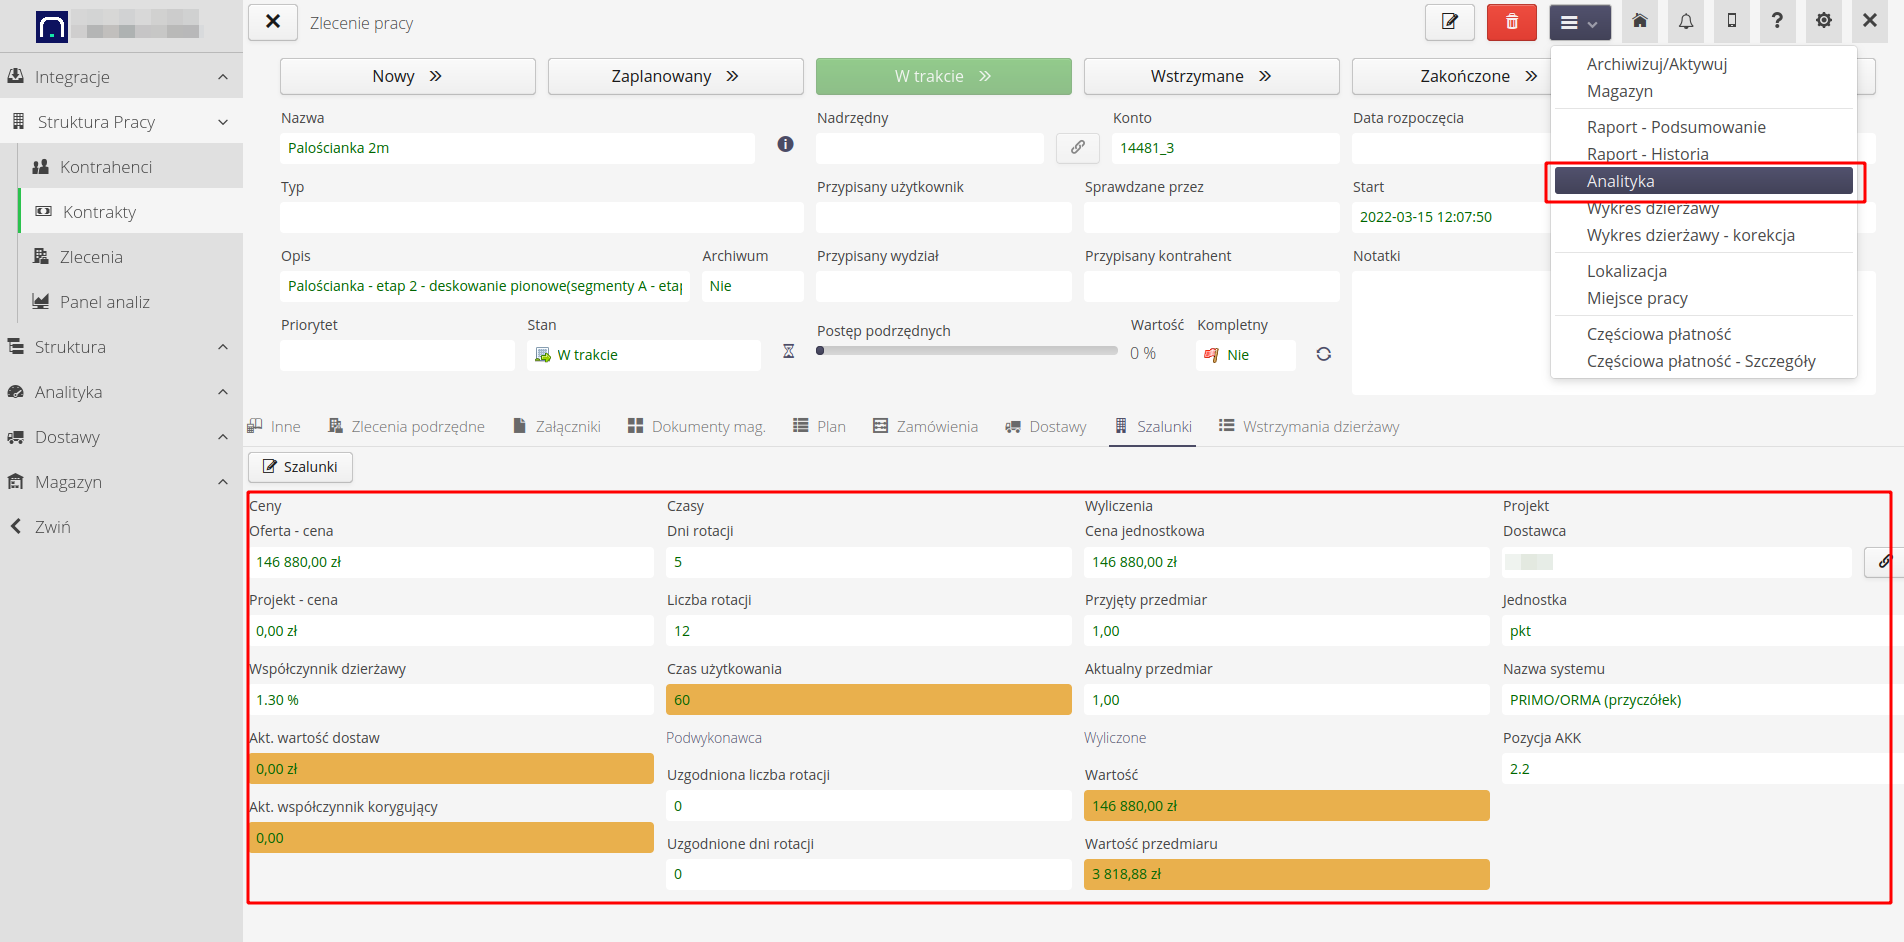
In the view of individual Structural Elements (EK) or work orders, we have information about the offer and definition data of a given area of work implementation. From this view, we can directly go to the analytics view using the context menu. We choose the Analytics action.

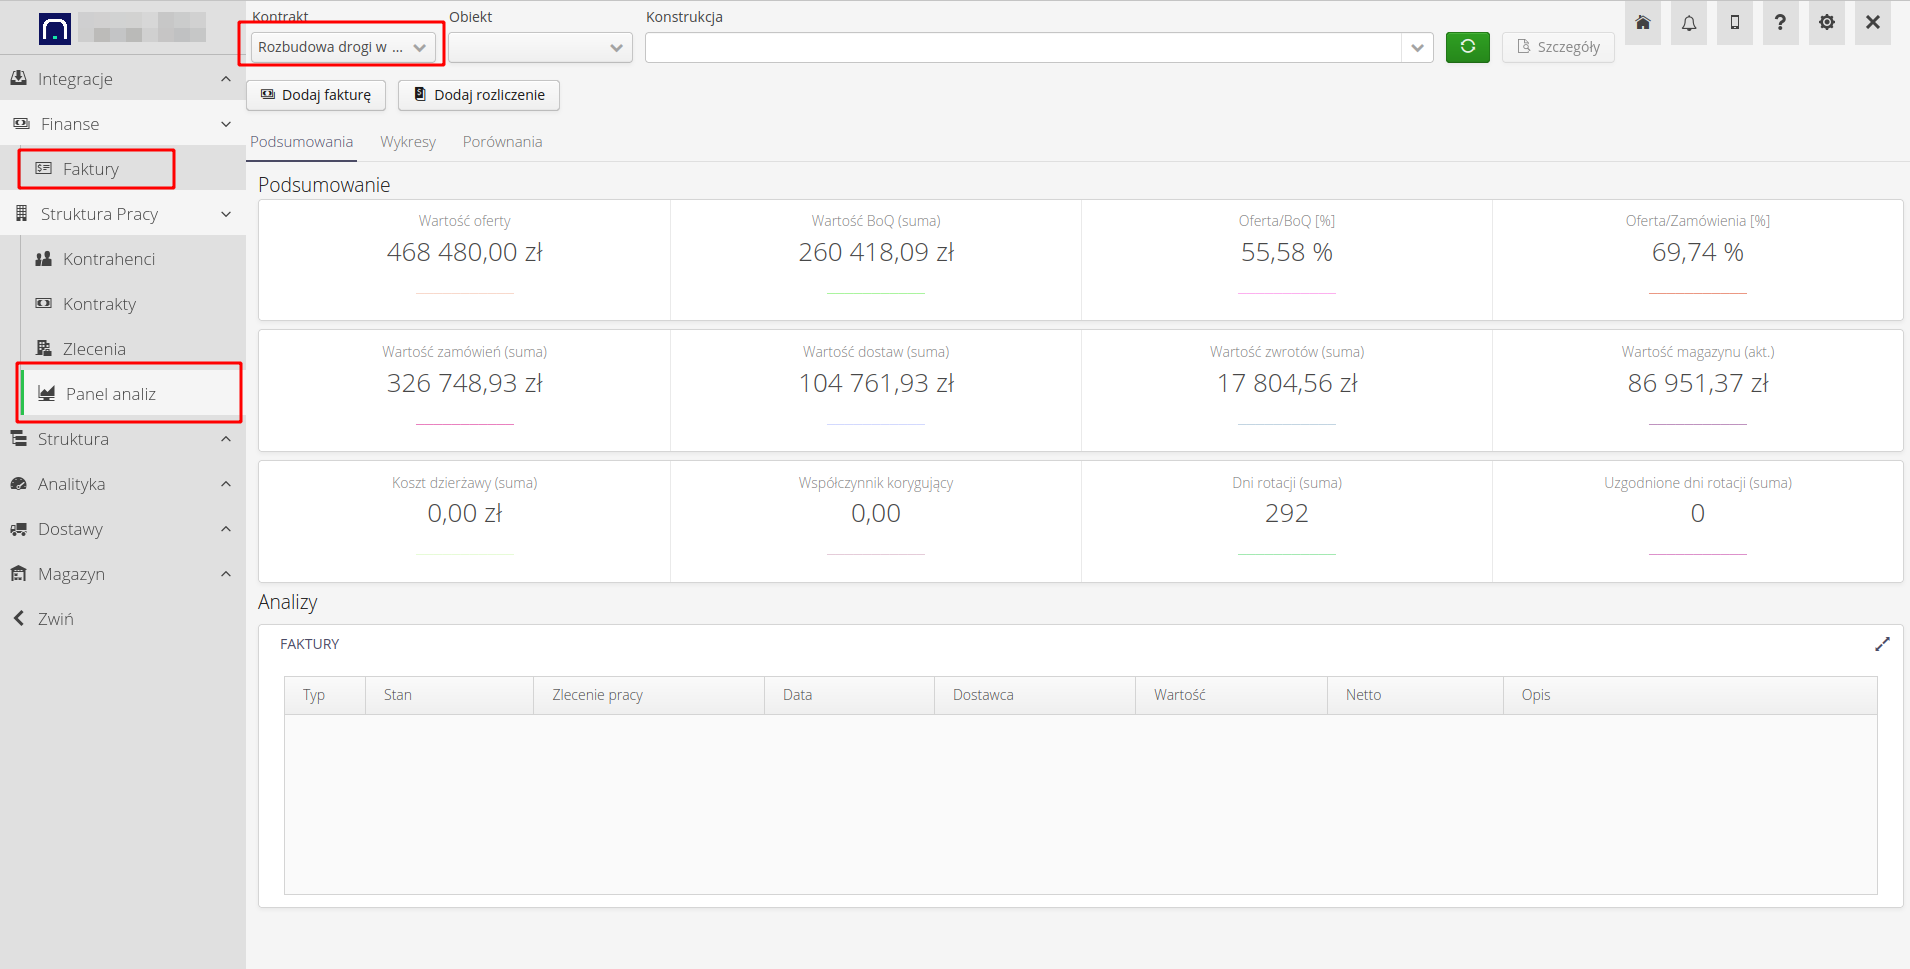
Entering the analytical view directly from the EK context allows for automatic setting of all data analysis filters. We can go to the same view from the main menu. Then select Work Structure → Analytics.
| The analytical view is configurable for each deployment. |
After calling the analytical view and selecting the appropriate context, the system generates information in three tabs. The tabs present information numerically and in the form of graphs. The data allows for the analysis of the contract in progress.
In the first tab, we present general information (summary) of the selected context (contract, object, structural element). The information here presents general offer information, comparison with the project and implementation, both in terms of amount and percentage. Performance metrics, lease values, and lease times. The graph shows information about active lease hold days.

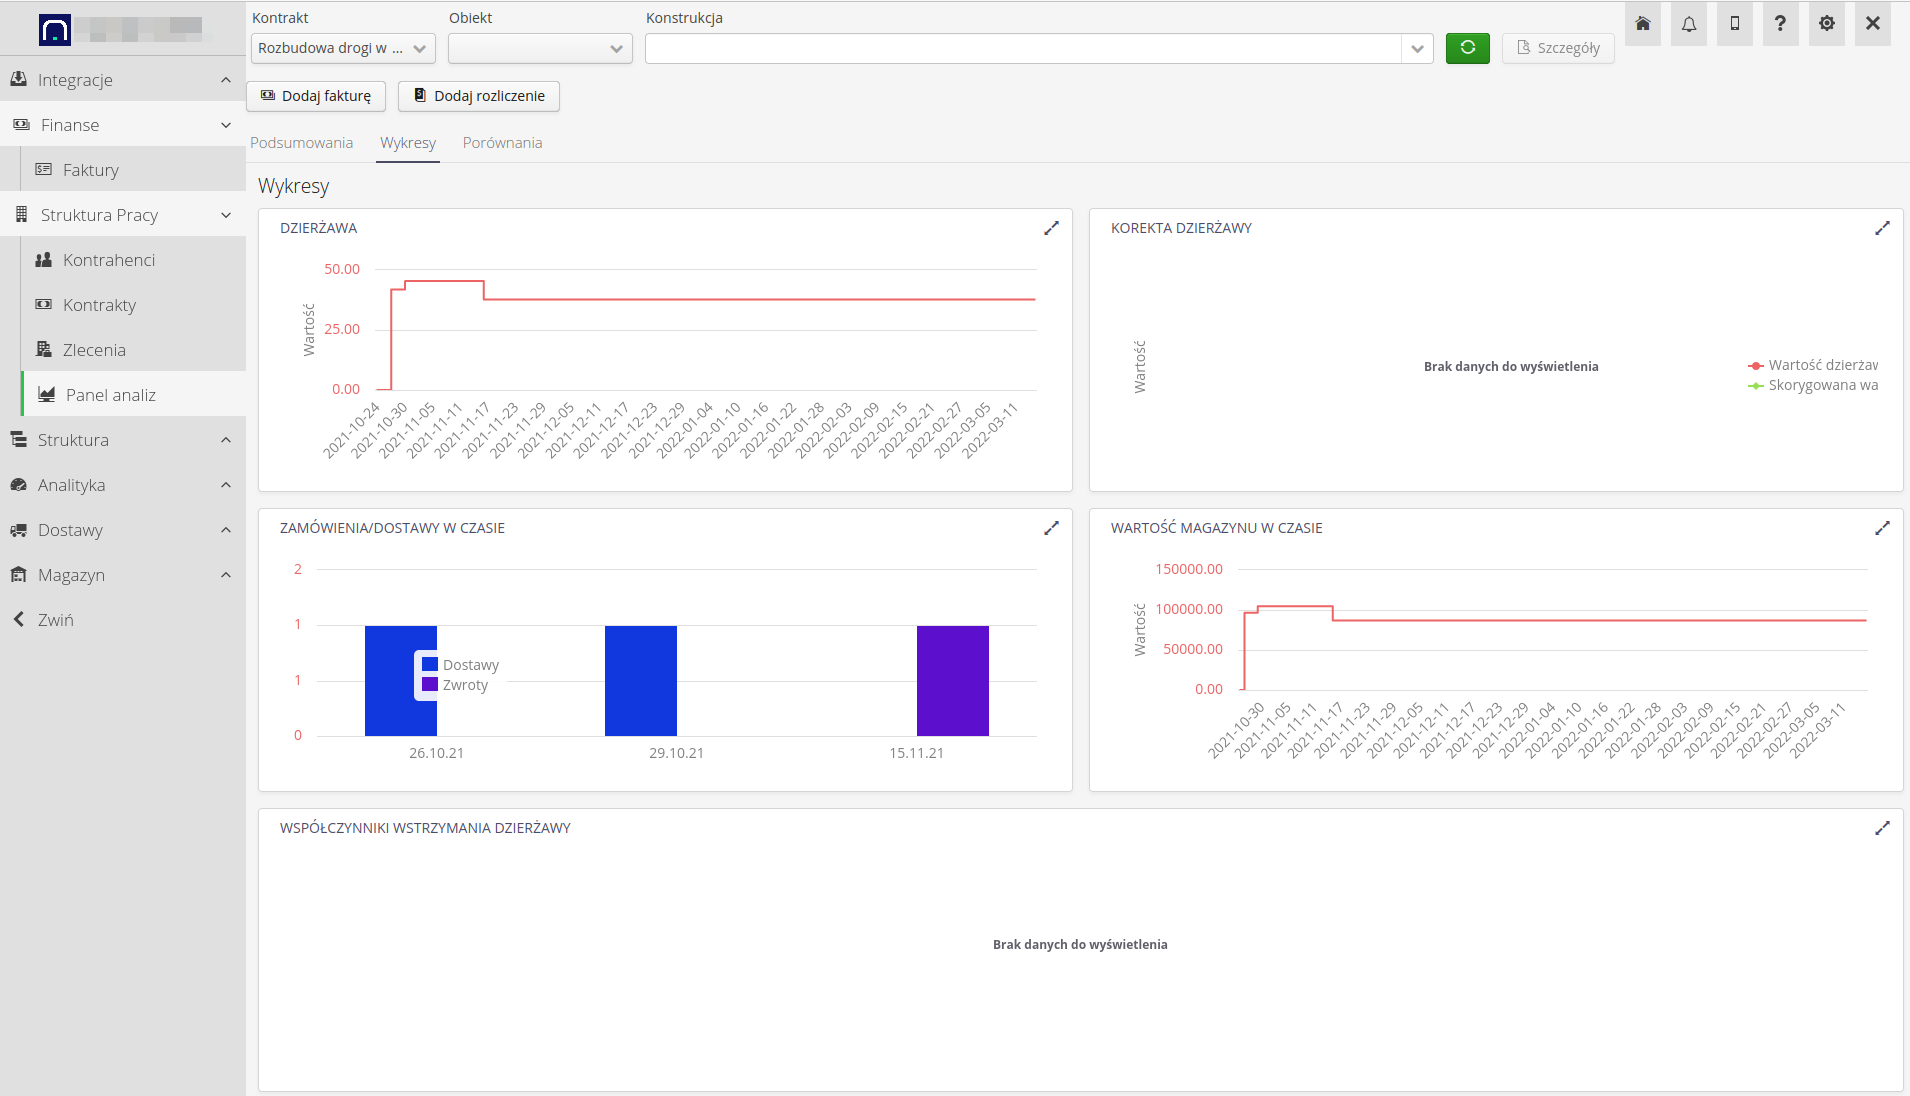
The second tab displays the following graphs: values of materials in stock over time, delivery and return dates, adjustment values (if a single structural element is selected) and lease value over time (including hold-ups).

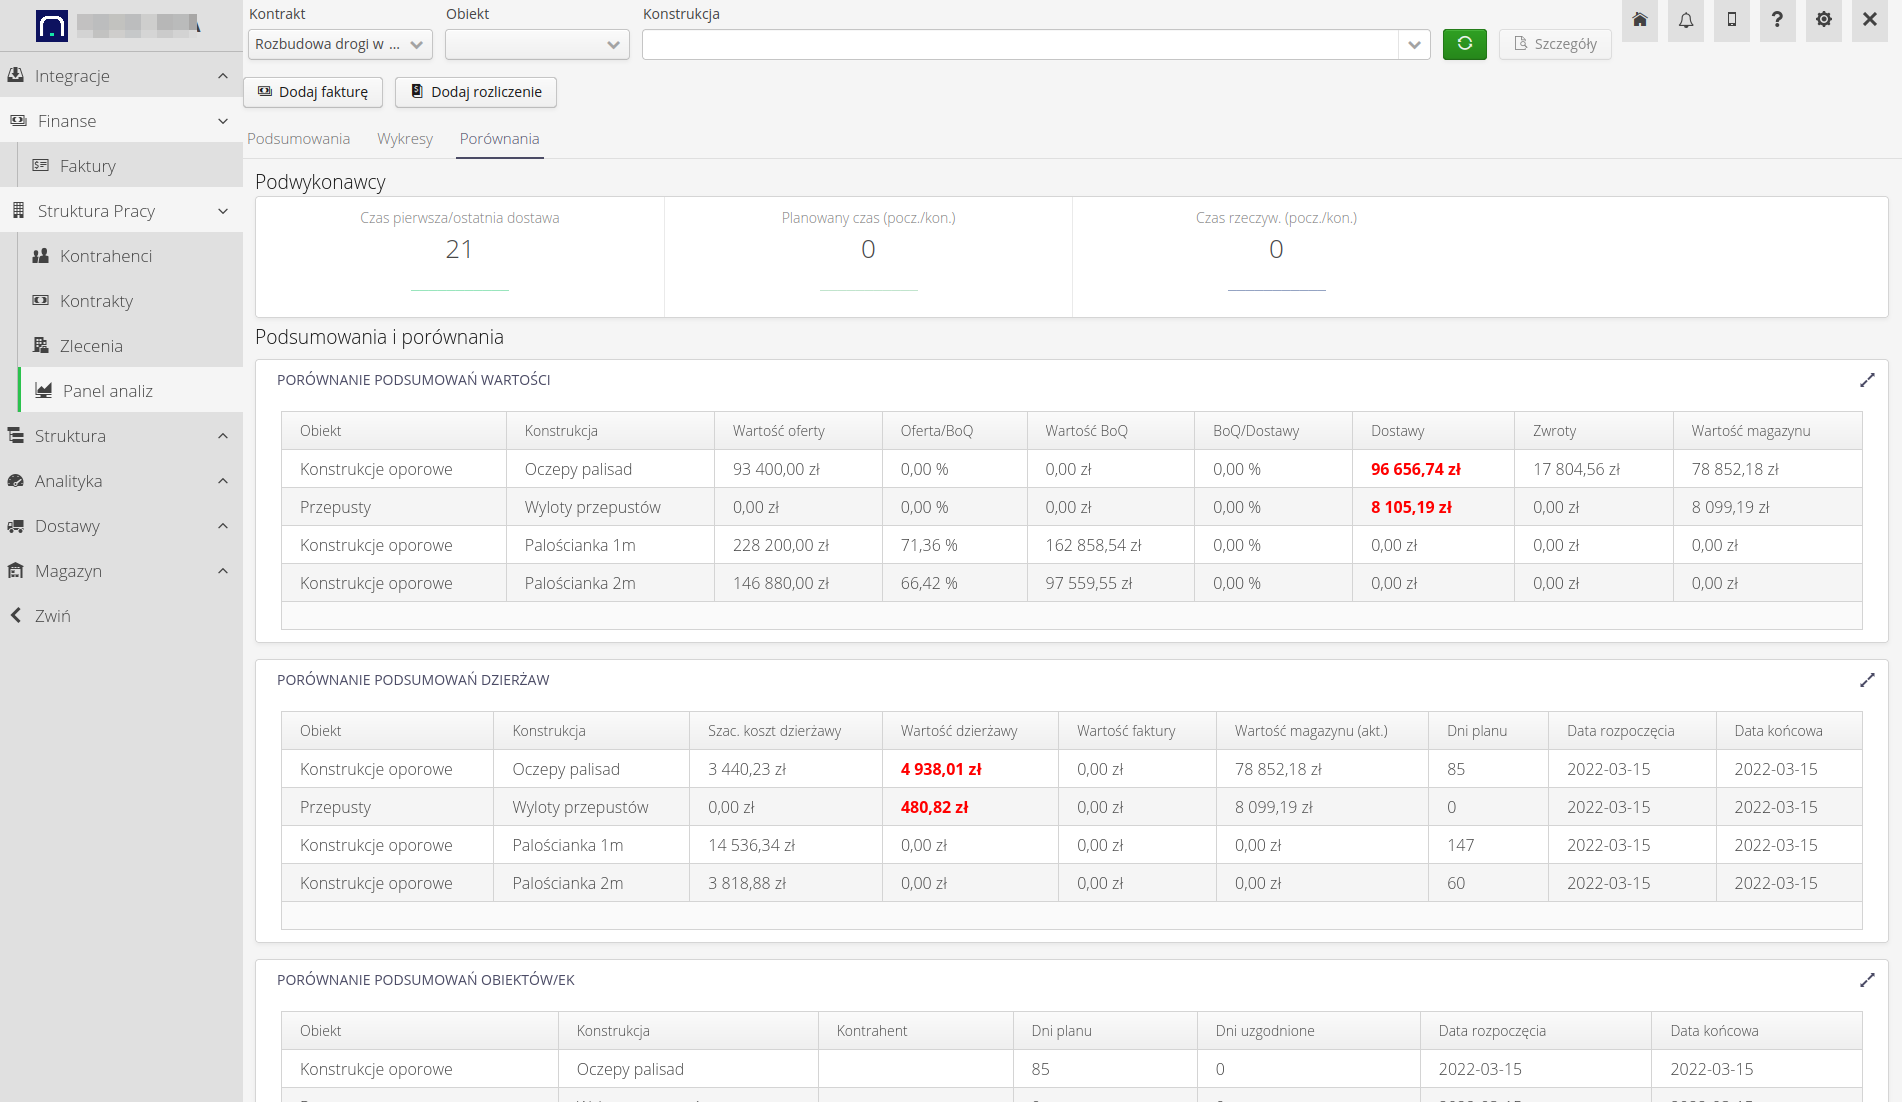
The third tab allows you to display analytical information broken down into individual structural elements (if the scope of the contract/object has been selected) with comparative information: financial, supplier settlements and contract performance indicators.

| All data is generated on an ongoing basis from the data available in the system. The dashboard does not use saved/archived analytical data, hence the time of data generation for individual tabs depends directly on the amount of data. |
| The Howto is based on system version 1.17.0.2 (03.2022) and presents features that may not be available in your system. Ask AMAGE about making this functionality available. |
| Due to the ongoing development of the system, some screens or configuration files may look slightly different, but will still retain the full functionality described here. This does not affect the essential functions described in this document. |